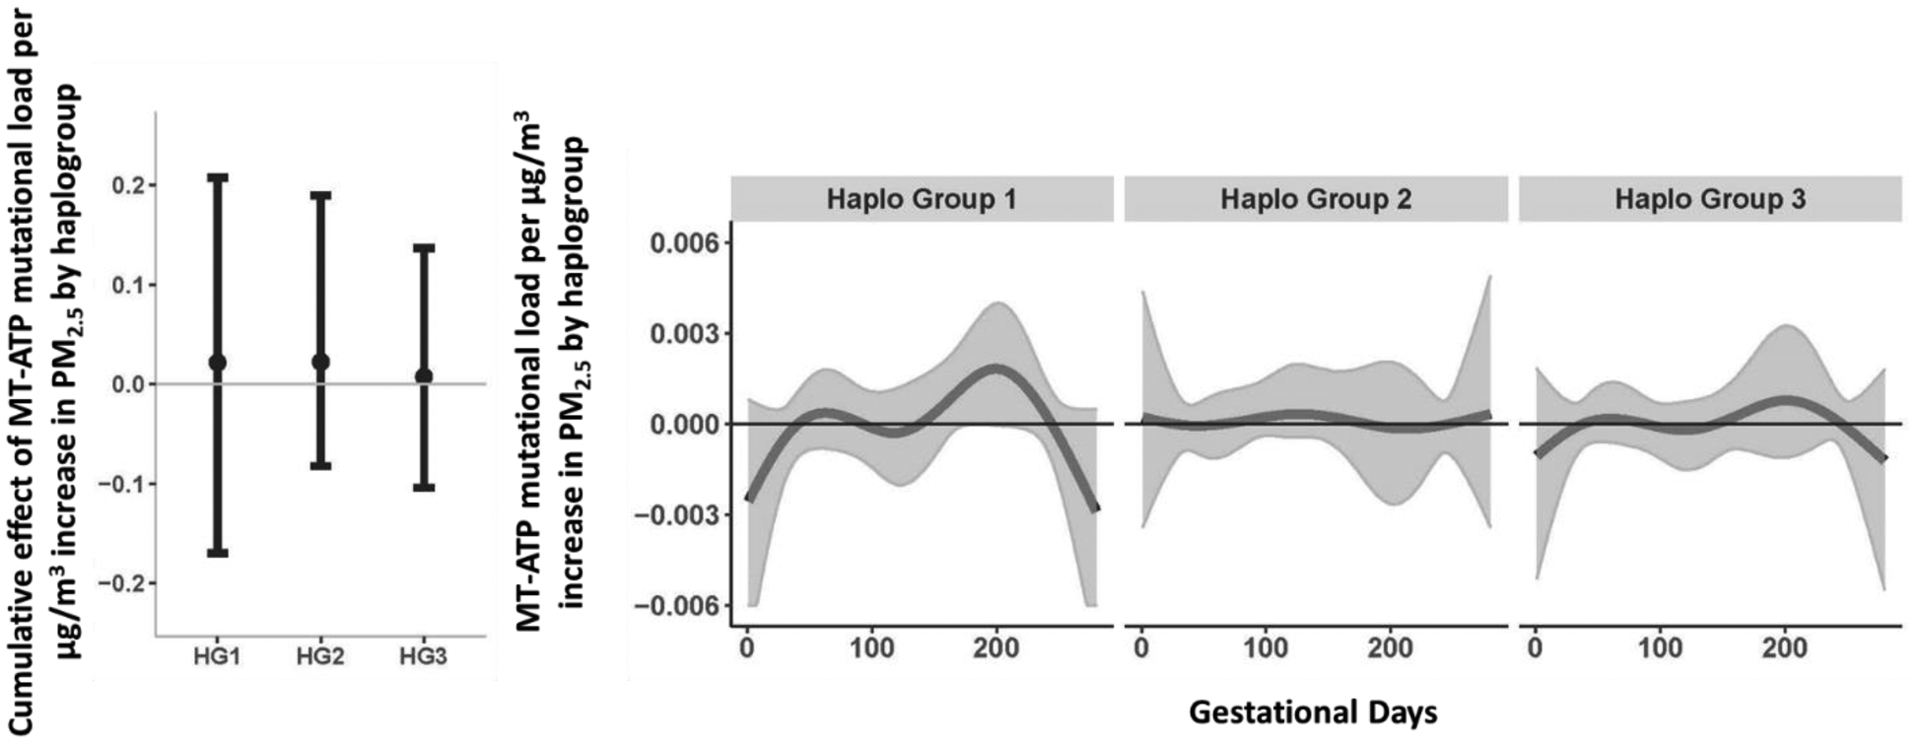
Figure 4. Cumulative and time-varying associations between daily PM2.5 levels over gestation and placental MT-ATP mutational load by haplogroup.

This figure demonstrates the effect modification by haplogroup on the association between PM2.5 exposure over pregnancy and mtDNA mutational load in the MT-ATP gene region, using BDLIM assuming daily-specific effects. The model was adjusted for maternal age, education, race/ethnicity, child sex, and ambient temperature. The y-axis represents the combined cumulative effect of time-varying prenatal PM2.5 exposure on increased mtDNA mutational loads for each haplogroup for which the BDLIM detected an interaction. Solid lines for time-varying associations show the predicted change in mtDNA mutational load. Gray areas indicate 95% confidence intervals (CIs). A sensitive window is identified for the days where the estimated pointwise 95% CI (shaded area) does not include zero. We did not observe any sensitive windows, but did observe varying magnitudes of effect by haplogroup. Abbreviations [Haplogroup1 (African); Haplogroup 2 (Native American/Asian); Haplogroup 3 (European)].
