
Figure 19.
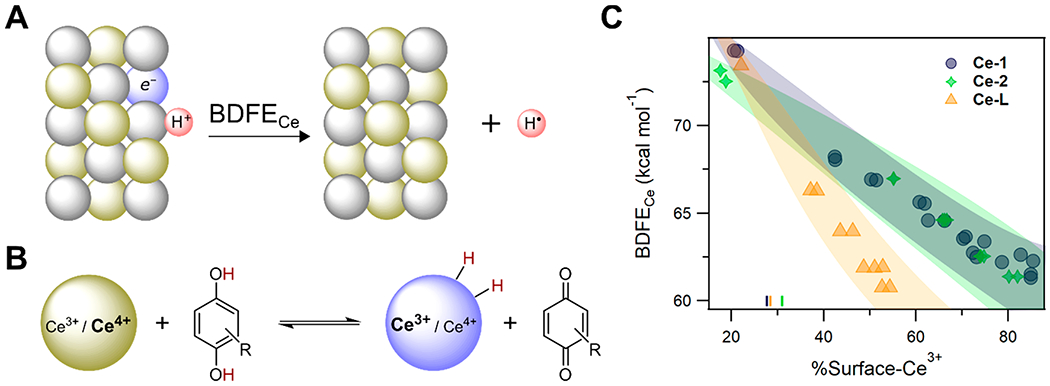
(A) Schematic of the chemical process defines the ceria–H BDFE; Ce4+: gold; Ce3+: purple; O2−: gray; H: red. (B) Equilibrium reaction of colloidal, oleate-ligated cerium oxide nanocrystals with hydroquinones and quinones. (C) Variation of CeO–H BDFEs with the % Ce3+ in the surface regions for three batches of nanocrystals, Ce-1, Ce-2, and Ce-L, with average diameters of 1.8 ± 0.2 nm, 1.9 ± 0.3 nm, and 4.0 ± 0.4 nm, respectively. Reprinted with permission from ref 286. Copyright 2021 American Chemical Society.