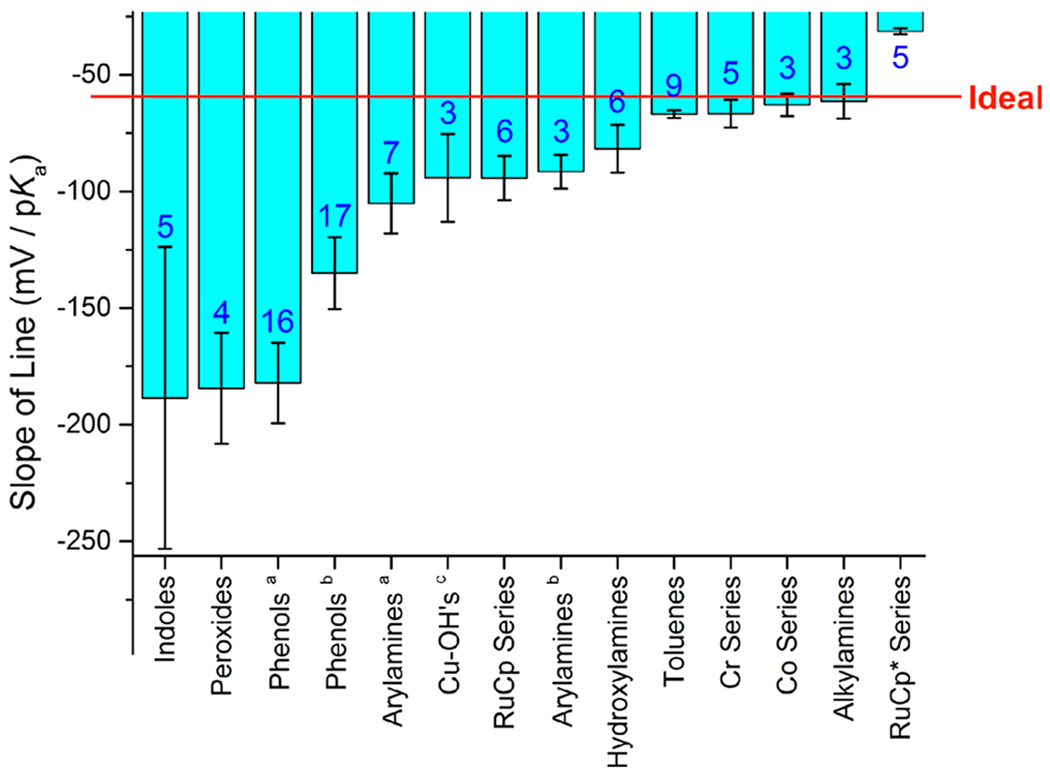
Figure 5.

Histogram depiction of compensation between E1/2 and pKa, for compounds within different classes of PCET reagents and in different solvents. Perfect compensation of −59.2 mV/pKa is indicated by the red line. Blue numbers in the bars are the number of compounds analyzed in each class. aIn water. bIn DMSO. cRef 92. Reprinted (adapted) with permission from ref 92, Supporting Information Figure S33, with blue numbers added. Copyright 2016 American Chemical Society.
