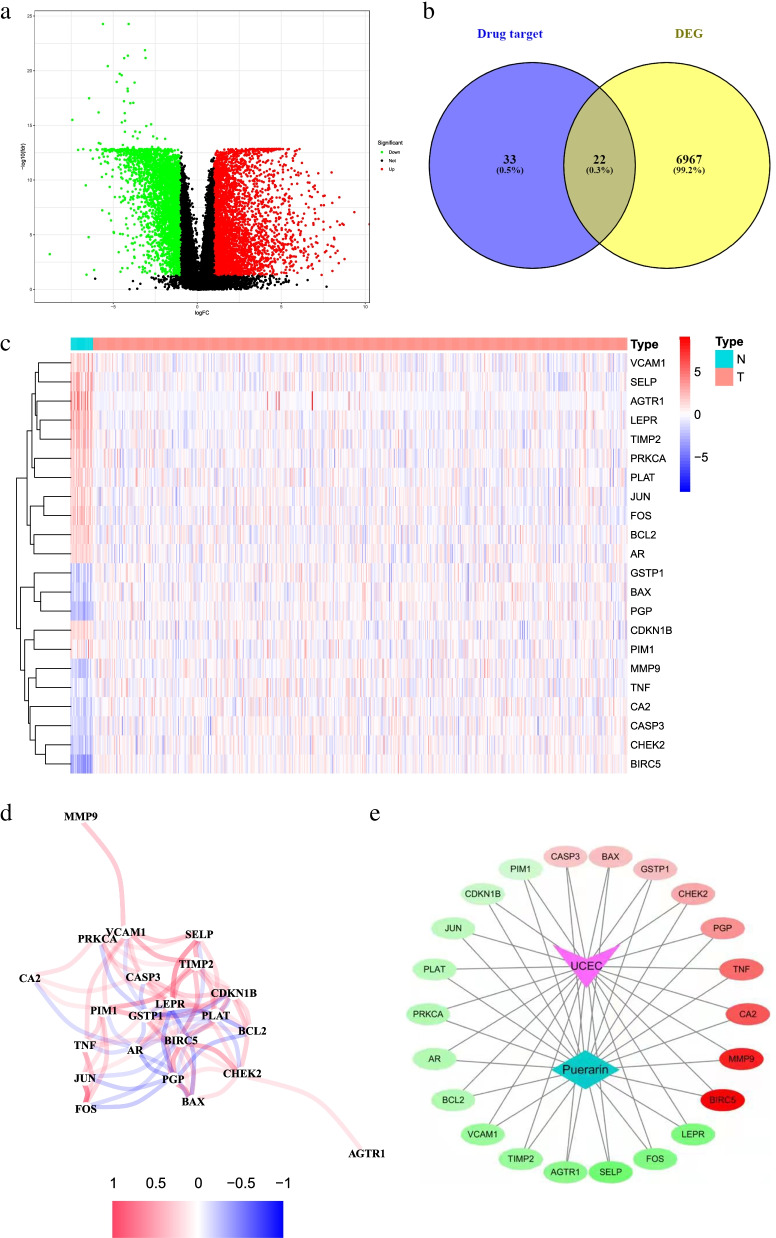
Fig. 2.
Drug-related differential genes of endometrial cancer and their interactions. a Volcano plot of 6989 differentially-drug genes in endometrial cancer; b Venny plot of 22 drug-related differential genes (DR-DEGs); c Heatmap of 22 DR-DEGs (N represents normal group, T represents tumor group; red represents high gene expression, blue represents low gene expression, and the depth of color represents the level of expression); d The relationship between 22 DR-DEGs (red line is Positive correlation, blue line is negative correlation, and the depth of color represents the strength of the correlation); e Disease- target-drug network diagram (red indicates gene up-regulation, green indicates gene down-regulation, and color depth represents the degree of regulation)

