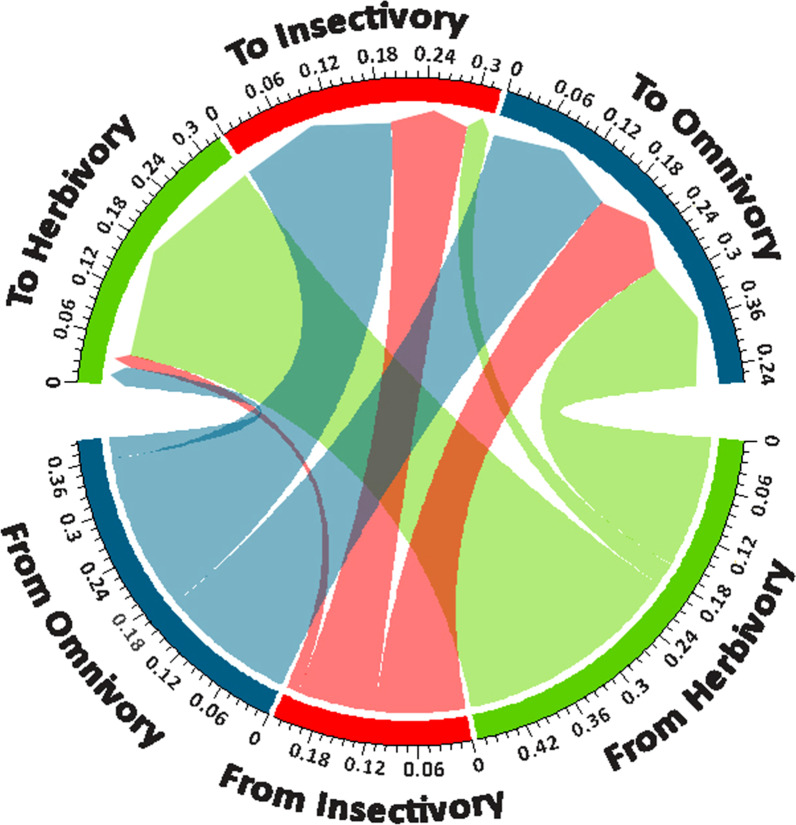
Fig. 3.
Trait conservatism and transition rates estimated across dietary states, where values are total cumulative rates for each diet type. The lower half of the circle shows the proportion that each diet contributes to trait conservatism (within the same diet) and transition to other diet types, and the upper half of the circle shows the contribution that each diet receives from transition events, whether is from its own dietary state (a trait conservatism process) or from other diets during all the speciation events on the phylogenetic tree

