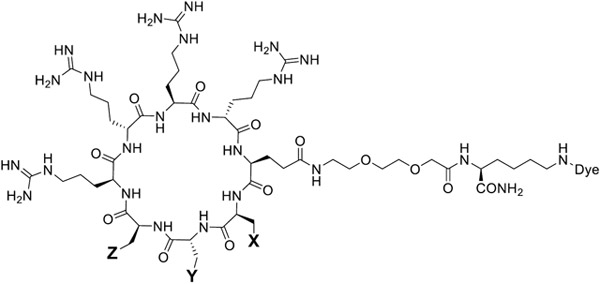
Table 1.
Structures and Cytosolic Entry Efficiencies of CPP12 Analogs

|
|||||
|---|---|---|---|---|---|
| Peptide No. | Peptide Sequencea | Cytosolic Entry at 10% FBS (MFINF, %)b |
Cytosolic Entry at 1% FBS (MFINF, %)b |
||
| X = | Y = | Z = | |||
| CPP12 | Phe | D-Phe | 2-Nal | 100 | 100 |
| CPP12-1 | Phe | D-Phe | 1-Nal | 69 ± 9 | 105 ± 16 |
| CPP12-2 | Phe | D-Phe | Bta | 375 ± 48 | 85 ± 7 |
| CPP12-3 | Phe | D-Fpa | 2-Nal | 59 ± 12 | 83 ± 2 |
| CPP12-4 | Phe | D-2-Pya | 2-Nal | 29 ± 9 | 35 ± 5 |
| CPP12-5 | Phe | D-4-Pya | 2-Nal | 115 ± 18 | 36 ± 5 |
| CPP12-6 | Phe | D-Tyr | 2-Nal | 32 ± 15 | 30 ± 12 |
| CPP12-7 | Fpa | D-Phe | 2-Nal | 74 ± 9 | 86 ± 15 |
| CPP12-8 | 2-Pya | D-Phe | 2-Nal | 27 ± 8 | 41 ± 16 |
| CPP12-9 | 4-Pya | D-Phe | 2-Nal | 22 ± 9 | 57 ± 18 |
| CPP12-10 | Tyr | D-Phe | 2-Nal | 25 ± 15 | 44 ± 10 |
Bta, L-3-benzothienylalanine; Fpa, L-4-fluorophenylalanine; D-Fpa, D-4-fluorophenylalanine; 1-Nal, L-1-naphthylalanine; 2-Nal, L-2-naphthylalanine; 2-Pya, L-2-pyridylalanine; D-2-Pya, D-2-pyridylalanine; 4-Pya, L-4-pyridylalanine; D-4-Pya, D-4-pyridylalanine.
All values are relative to that of CPP12 (100%) and represent the mean ± SD of three independent experiments.
