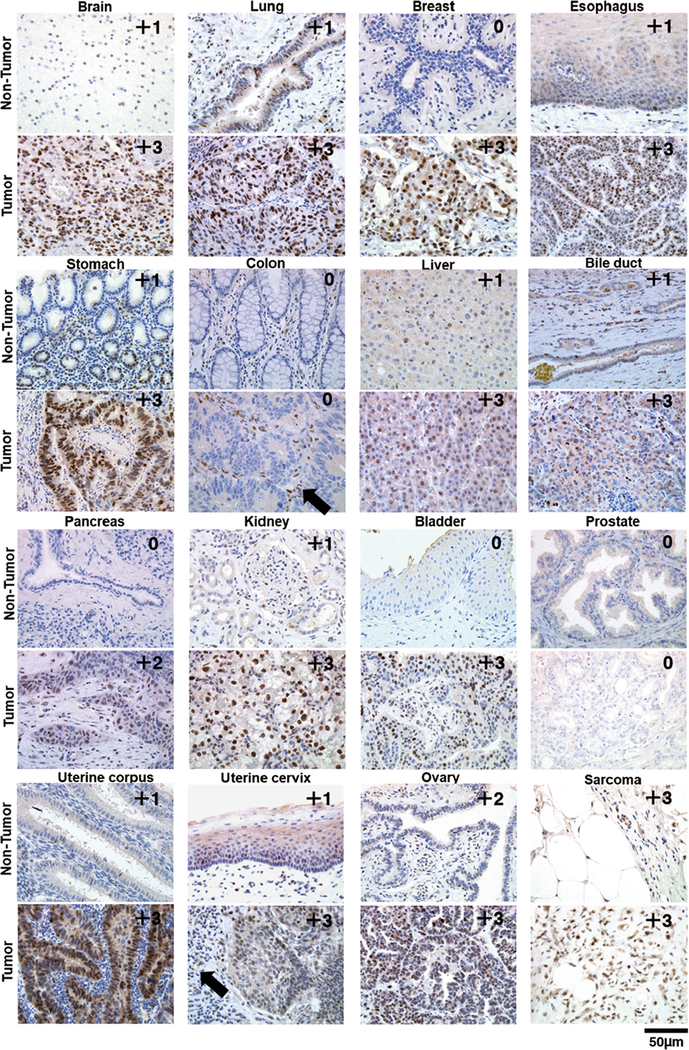
Fig. 2.
Representative images of immunohistochemistry (IHC) for non-tumor and tumor regions in the indicated organs. The pairs of non-tumor and tumor samples of each organ are not always from identical patients. IHC scores are annotated at the top right of each panel. The black arrows indicate inflammatory cells surrounding the main components

