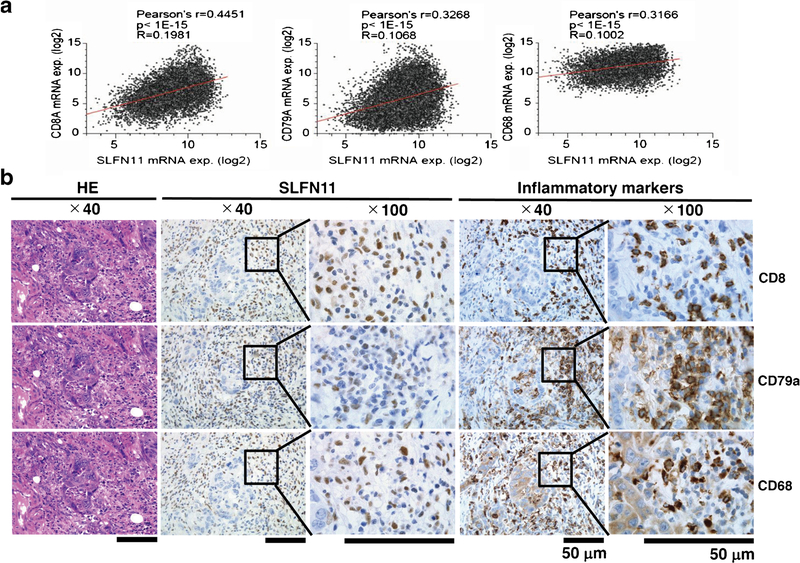
Fig. 5.
Expression of SLFN11 in inflammatory cells. a Plots of SLFN11 expression (x axis) and the indicated inflammatory cell markers (CD8A, left; CD79A, centre; CD68, right) expression (y axis) in TCGA Pan-Cancer Atlas dataset. Statistical analysis results are shown above each panel. b Sequential tissue sections of colorectal cancer were analyzed with HE staining (left) and immunohistochemistry (IHC) for SLFN11 (centre) and IHC for inflammatory markers (right top, CD8; right middle, CD79A; right bottom, CD68) (Original magnification: × 40 and × 100). Scale bars are 50 μm in the enlarged images

