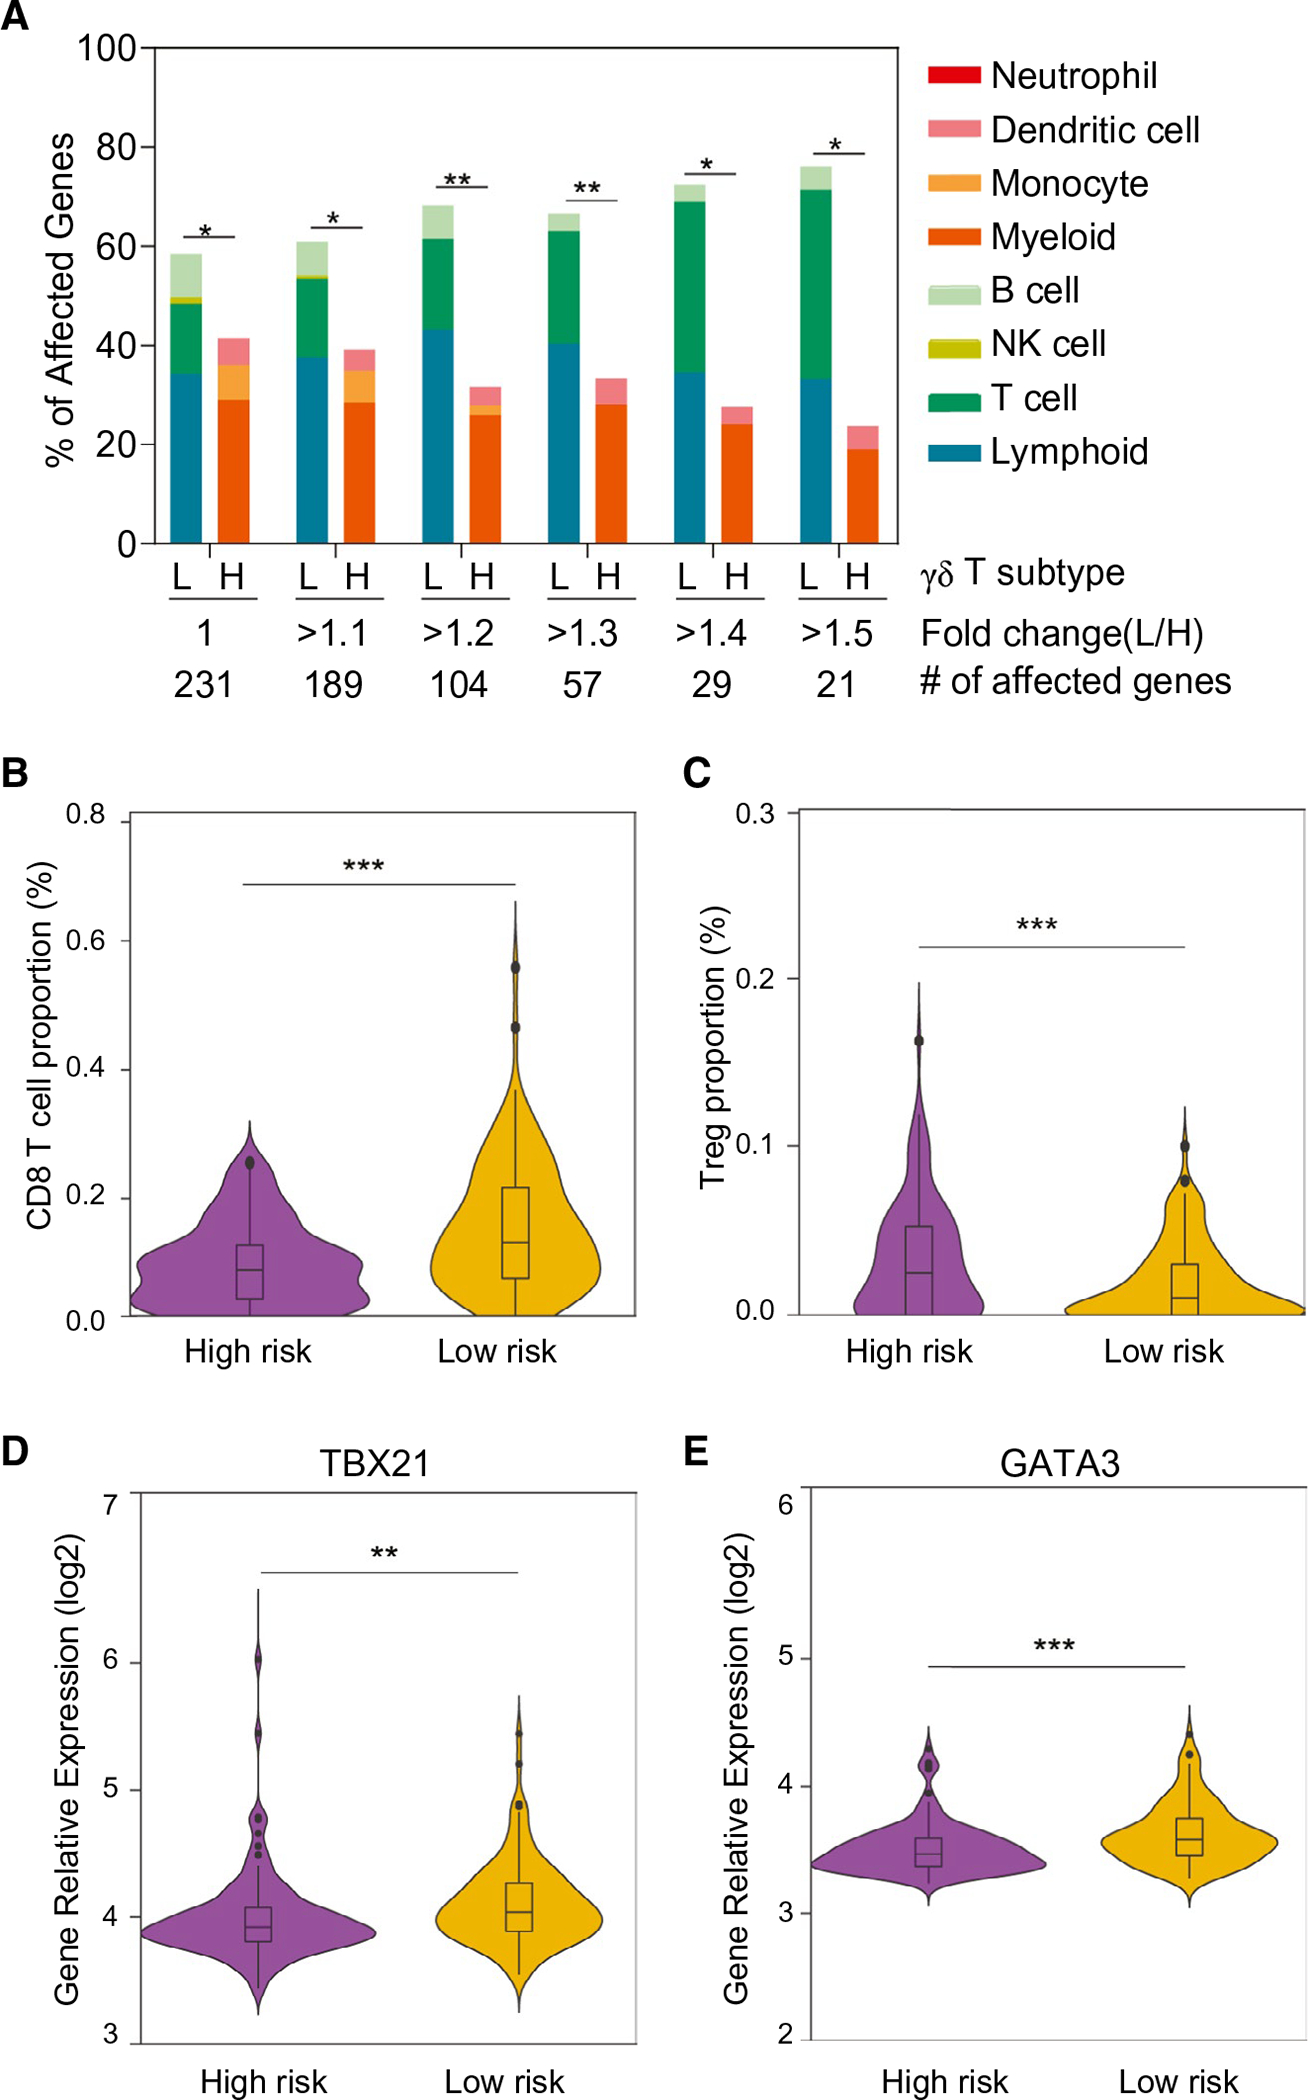
FIG. 4.

Expression profiles of immune-cell–related genes in the two subgroups defined by γδ T-cell-specific gene signature. (A) Immune-cell gene expression profiles based on γδ T LR and γδ T HR subgroups. Among 1,622 immune cell genes defined by immune response in silico, 231 genes unique for each cell type were used to calculate the percentage of affected genes. Total numbers of significantly expressed genes (adjusted P < 0.05) with different fold changes between the LR and HR subgroups are indicated. *P < 0.05; **P < 0.01 from the hypergeometric probability test. (B,C) The composition of two main immune cells’ subgroups between the predefined low- and high-risk HCC tumor groups. Proportion of CD8+ (B) and Treg (C) were calculated using the array data. Comparison of the expression levels of the transcription factors, TBX21 (D) and GATA3 (E), involved in the T-cell differentiation between the predefined low- and high-risk HCC tumor groups. Abbreviation: L/H, low/high. **P < 0.001; ***P < 0.001.
