
Figure 1. Loss of FMRP affects GABAAR single-channel properties.
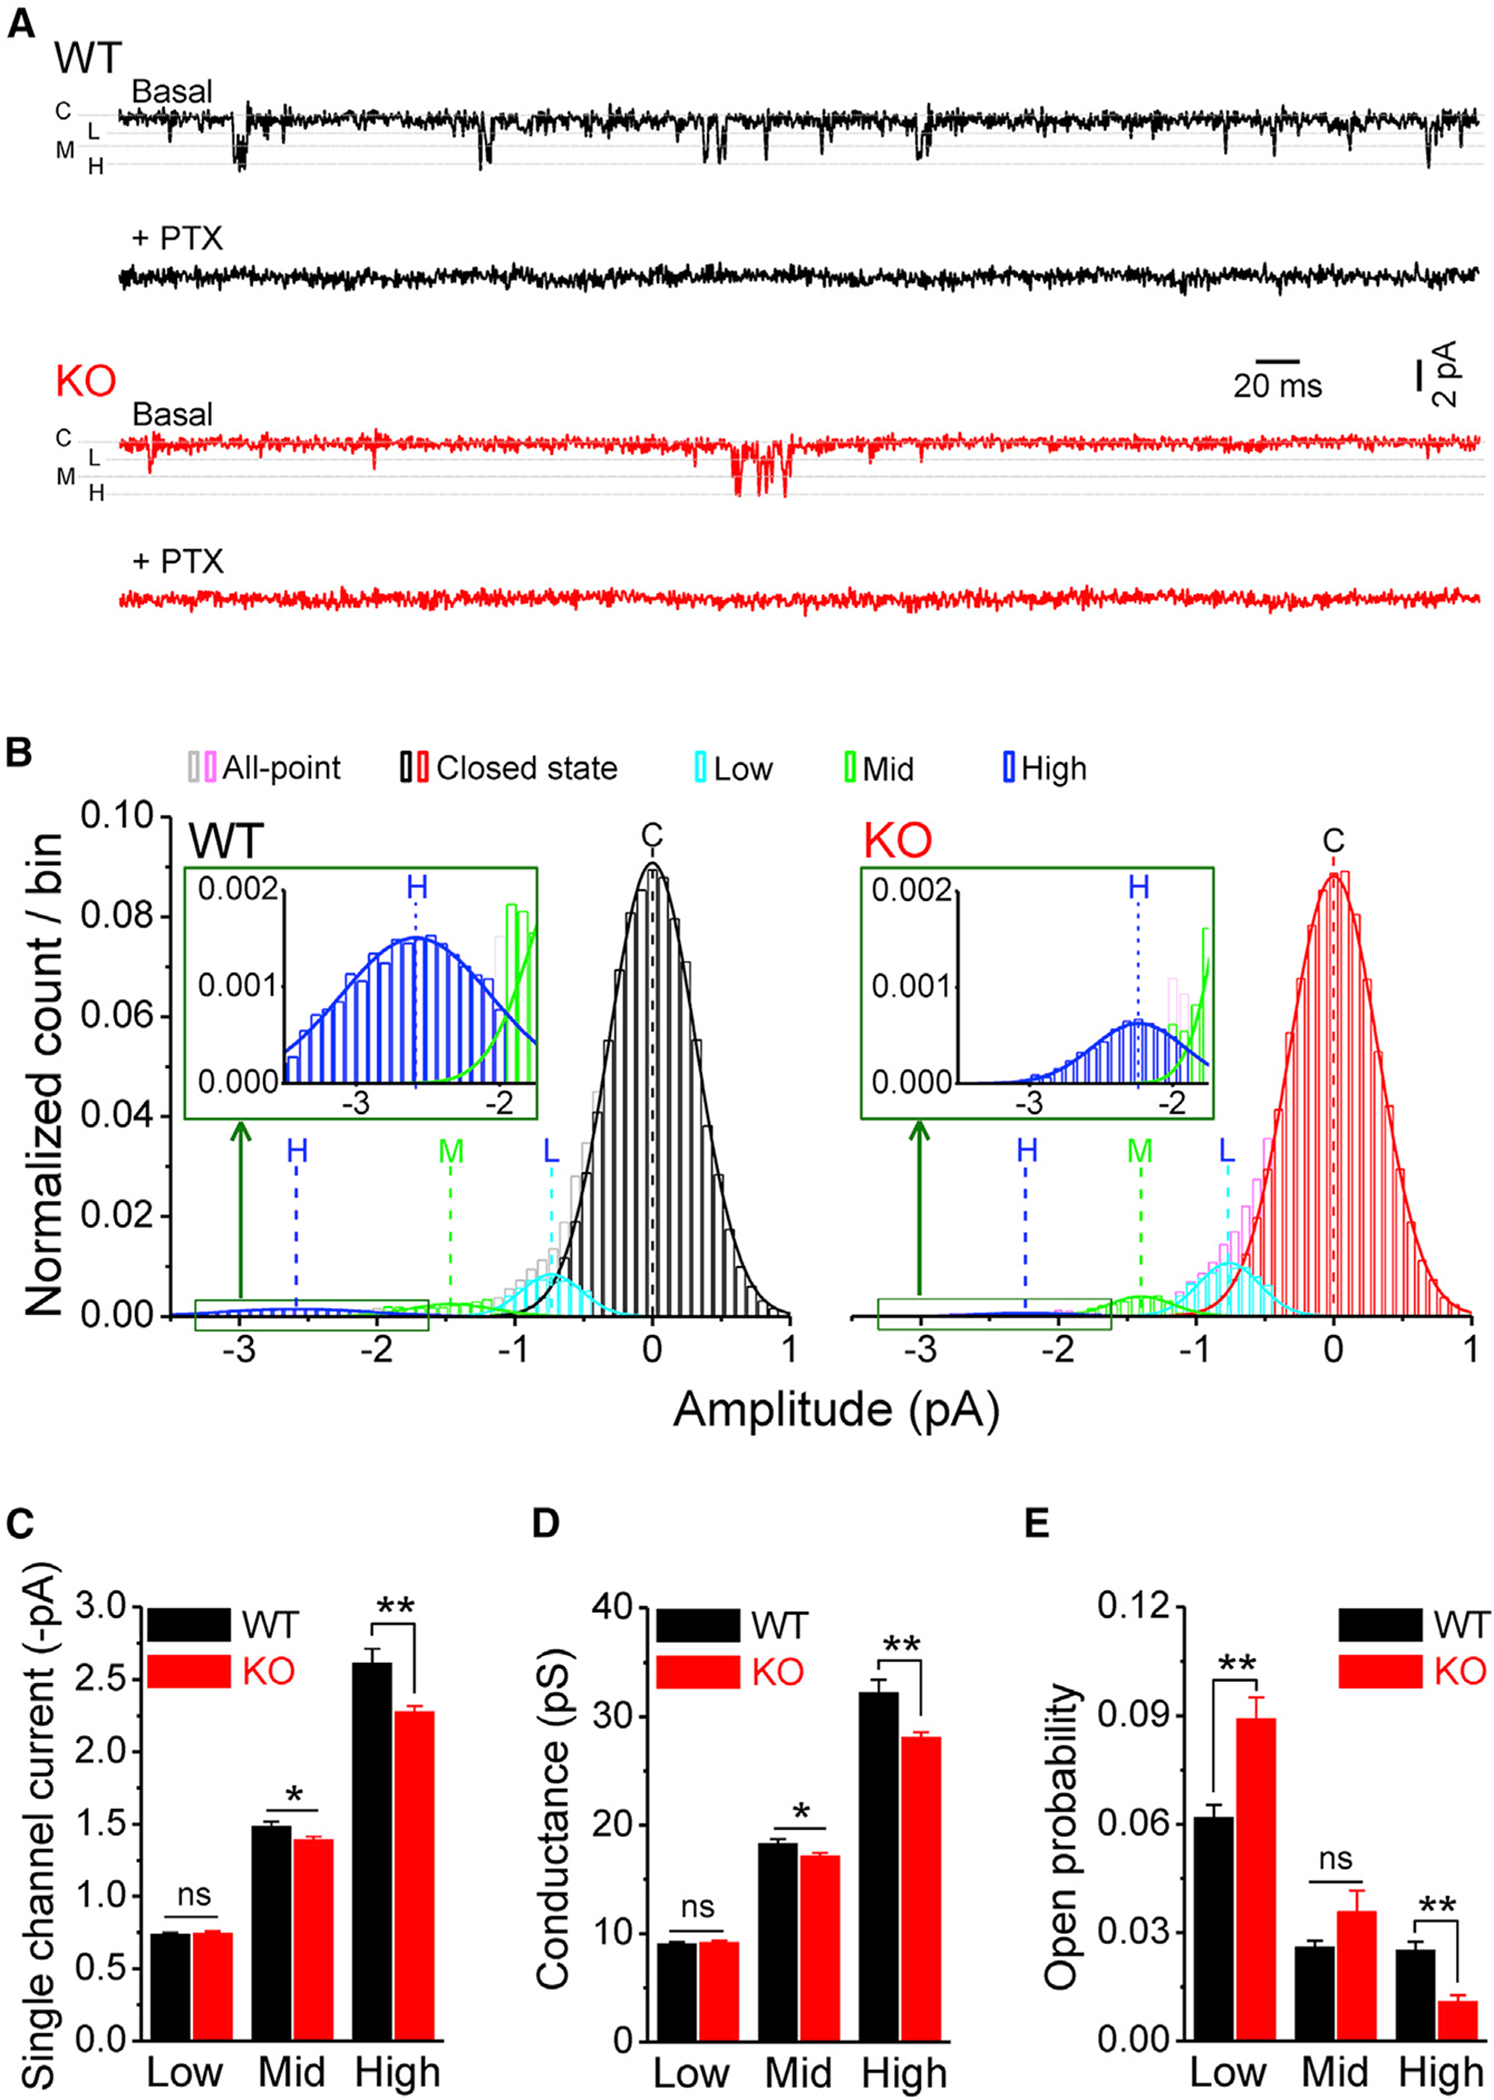
(A) Sample traces of GABAAR single-channel recordings in outside-out patches from dentate gyrus GCs in WT (black) and Fmr1 KO (red). Line C denotes a closed state; lines L, M, and H are low-, mid- and high-conductance states, respectively. Note that picrotoxin (PTX) completely blocked all openings.
(B) All-point distribution of single-channel recordings and isolation of 3 open states using Gaussian fit with subtraction method (see Figure S1). Lines C, L, M, and H denote centers of Gaussian fits of closed, low- (cyan), mid- (green), and high- (blue) conductance states, respectively. Inserts, enlargements of high-conductance states. For comparison among patches, the number of data points per bin was normalized to the corresponding total data points.
(C and D) Summarized data of single-channel currents (C) and conductances (D) of GABAARs’ low-, mid-, and high-conductance states.
(E) Open probability of GABAAR’s low-, mid-, and high-conductance states.
*p < 0.05; **p < 0.01; ns, not significant. The statistical data are listed in Table S1. Data are mean ± SEM.