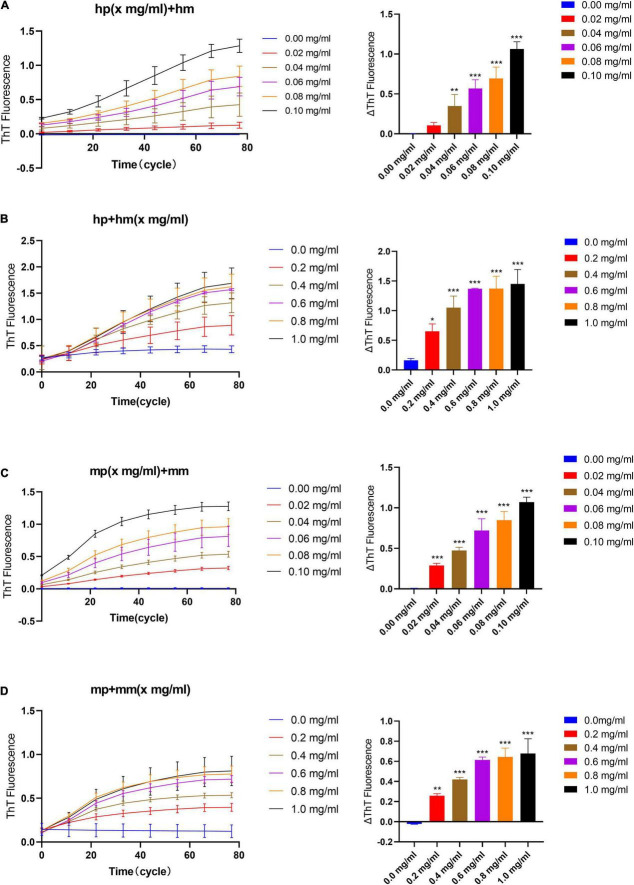
FIGURE 2.
The effect of seeds and monomer concentration on the quiescent incubation curve of fibril seeds. (A) Fluorescence curve of quiescent incubation of human fibril seeds with different concentrations at fixed monomer concentration, left. Corresponding ΔThT fluorescence value, right. (B) Fluorescence curve of the quiescent incubation of human fibril seeds at different monomer concentrations, left. Corresponding ΔThT fluorescence value, right. (C) Fluorescence curve of quiescent incubation of mouse fibril seeds with different concentrations at fixed monomer concentration, left. Corresponding ΔThT fluorescence change value, right. (D) Fluorescence curve of the quiescent incubation of mouse fibril seeds at different monomer concentrations, left. Corresponding ΔThT fluorescence value, right. All data are expressed in mean ± SD. Compared with the 0 mg/ml group, *P < 0.05, **P < 0.01, ***P < 0.001.

