FIG 6.
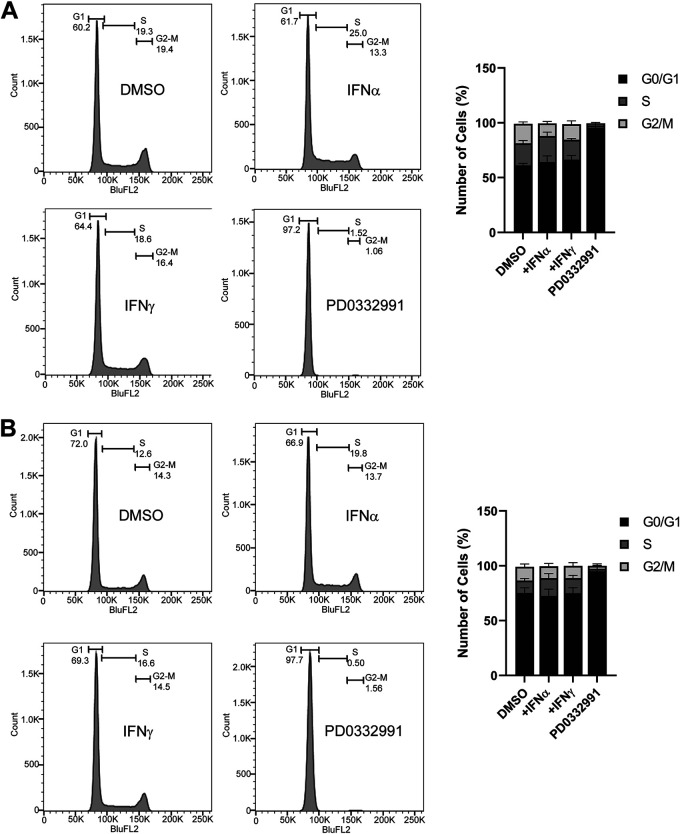
HDF cells cycle normally despite IFN treatment. HDFs were treated with IFN-α, IFN-γ, palbociclib (PD) (2 μM), or control DMSO for 24 h (A) or 48 h (B). Cells were washed, fixed, stained with propidium iodide (PI), and analyzed by flow cytometry for DNA content. Cells were gated for single cells, for pulse shape, and then for PI signal histograms, and cell cycle profiles were determined, as shown. Values are plotted as means ± SD (n = 3). The bar graphs represent summaries of the results.

