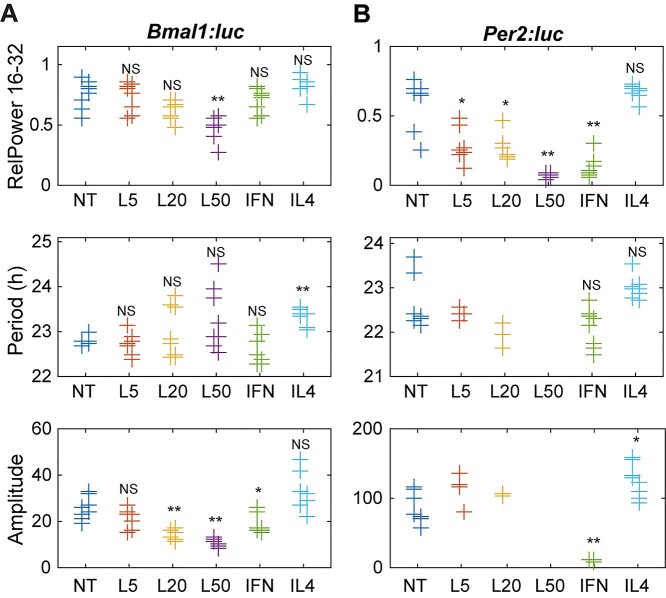
Figure 2.
Circadian parameters for (A) Bmal1 and (B) Per2 oscillations following cytokine treatments. Shown are measures of strength of rhythmicity (top), period (middle), and amplitude (bottom). The measure of rhythmicity is the relative power in the 16- to 32-h band of the power spectral density. The period and amplitude are estimated by fitting each time series to a damped cosine curve. Data points are color-coded by dose; within each, data is separated by experiment (those slightly to the left are from the first, and those to the right are from the second). The distribution of measures for each treatment is compared to that of the non-treated samples using a randomization test for difference in means (NS indicates “not significant,” *p < 0.05, **p < 0.01, and no indicator above a treatment indicates that there were too few data points for the test to have sufficient power). Time series that did not fit well to a damped cosine (GOF < 0.9) were excluded from period and amplitude evaluations. NT = non-treated; L5 = 5 ng/mL LPS; L20 = 20 ng/mL LPS; L50 = 50 ng/mL LPS; IFN = 5 ng/mL LPS and 12 ng/mL IFN-γ.

