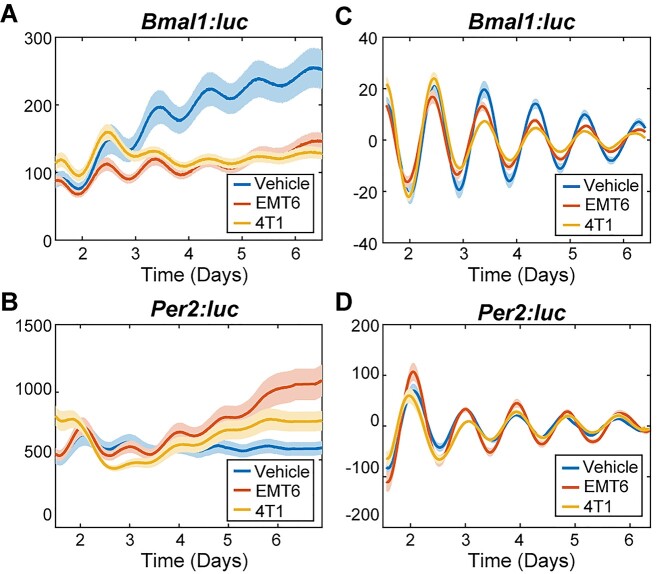
Figure 3.
Bioluminescence rhythms of Bmal1 and Per2 promoter activities following macrophage exposure to cancer-conditioned media. Shown are raw (A,B) and detrended, smoothed (C,D) time series averaged across replicates (N = 12) for each treatment. The standard error is shown with a light envelope around the mean; in some instances, this is too small to be visualized. The raw data and detrended data with individual replicates can be found in Fig. S9 and S10, respectively.

