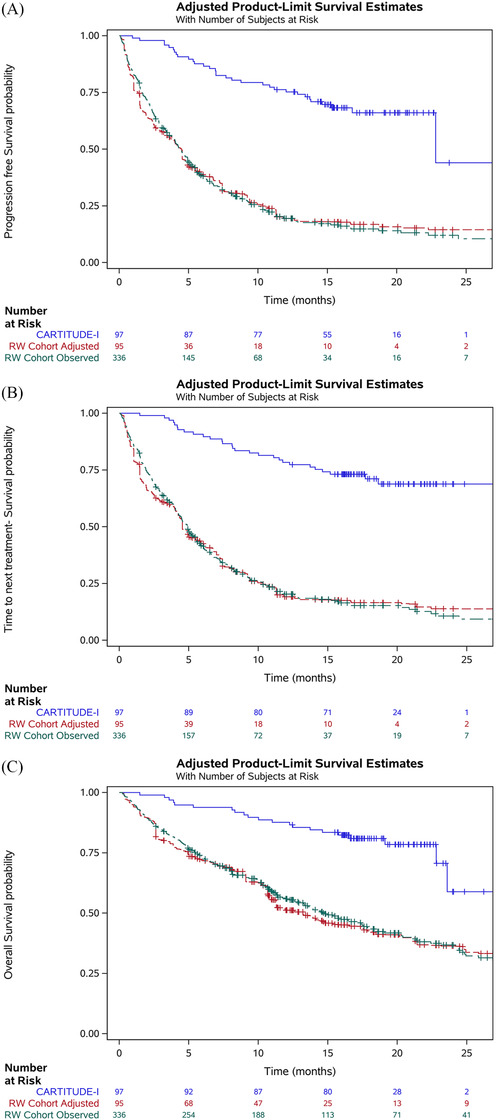
FIGURE 2.

Kaplan–Meier plots for (A) progression‐free survival, (B) time to next treatment, and (C) overall survival in CARTITUDE‐1 (observed) and the RW cohort (observed and adjusted). Note: Number at risk for the adjusted RW cohort represents the sum of the propensity score weights, not the effective sample size. Adjusted results correspond to the base case analysis which adjusted for refractory status, International Staging System stage, cytogenetic profile, time to progression on last regimen, number of prior lines of therapy, years since multiple myeloma diagnosis, and age. The adjusted curves reflect inverse probability of treatment weighting with average treatment effect in the treated weights (not doubly robust). Abbreviation: RW, real world
