
FIGURE 2.
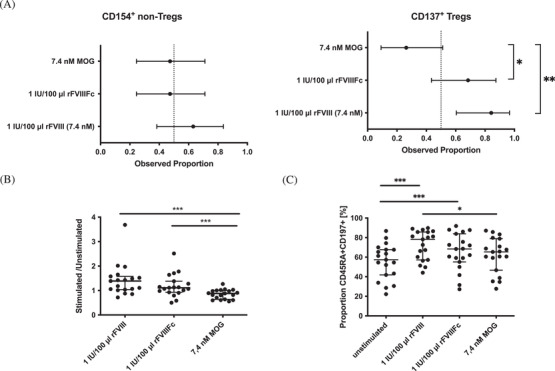
Response of activated regulatory T cells (Tregs) and non‐Tregs towards factor VIII (FVIII) and myelin‐oligodendrocyte protein (MOG). Following stimulation of peripheral blood mononuclear cells (PBMCs) isolated from buffy coats of healthy individuals with full‐length FVIII (rFVIII), the fusion protein (rFVIIIFc) and MOG for 16 h, the proportion of samples responding to the stimuli based on surface expression of CD154 (non‐Treg) or CD137 (Treg) was compared. MOG was used in an equivalent molar concentration as rFVIII. A total of 85,421 to 125,377 (median: 97,982) CD4+ T cells was acquired. (A) The rate of responsiveness to stimuli is presented with a two‐sided 95% Clopper‐Pearson confidence interval (CI95). Intensities of responsiveness were compared using Wilcoxon signed‐rank test or Friedman Test. Tregs reacted more often against rFVIII and rFVIIIFc than against MOG. (B) When comparing the intensity of the response of stimulated Tregs, the intensity was higher for the response towards rFVIII and rFVIIIFc. (C) CD154+ CD137– non‐Tregs were further classified based on markers CD45RA and CD197. The proportion of naïve CD45RA+ CD197+ non‐Tregs reacting to the stimuli was compared and was higher for rFVIII and rFVIIIFc compared to the unstimulated control. Of interest, the proportion of naïve cells responding to rFVIII was also significantly higher than the proportion of MOG‐specific naïve cells. All tests were two‐sided and a p < 0.05 was considered significant.