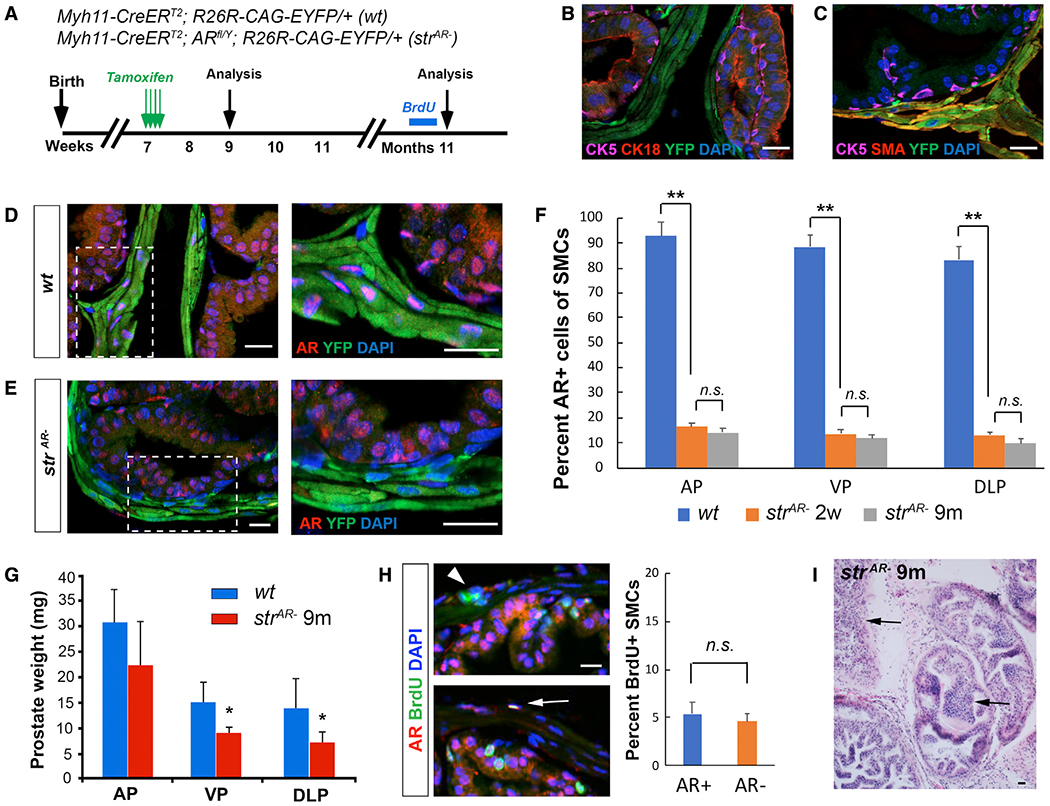
Figure 1. AR deletion in SMCs of the normal adult prostate.

(A) Timeline of experiments for the wt and strAR− mice.
(B and C) IF staining showing YFP-marked cells present only in the stroma (B) and positive for SMA (C).
(D and E) IF staining showing loss of AR expression in YFP+ cells from wt (D) to strAR− (E). Zoom-in views of the boxed areas are shown on the right.
(F) Quantitation of the proportions of AR+ SMCs in different prostate lobes before and after AR deletion through time.
(G) Quantitation of prostate lobe weights in wt and strAR− mice 9 months after induction.
(H) Representative IF staining of BrdU (left) and quantitation of the proportions of BrdU+ cells in AR+ and AR− SMCs (right). Arrowhead points to an AR−BrdU+ SMC and arrow to an AR+BrdU+ SMC.
(I) H&E staining showing prostate morphology of strAR− mice 9 months after induction. Arrows point to regions of hyperplasia. *p < 0.05 and **p < 0.001 by Student’s t test. Scale bars, 20 μm.
