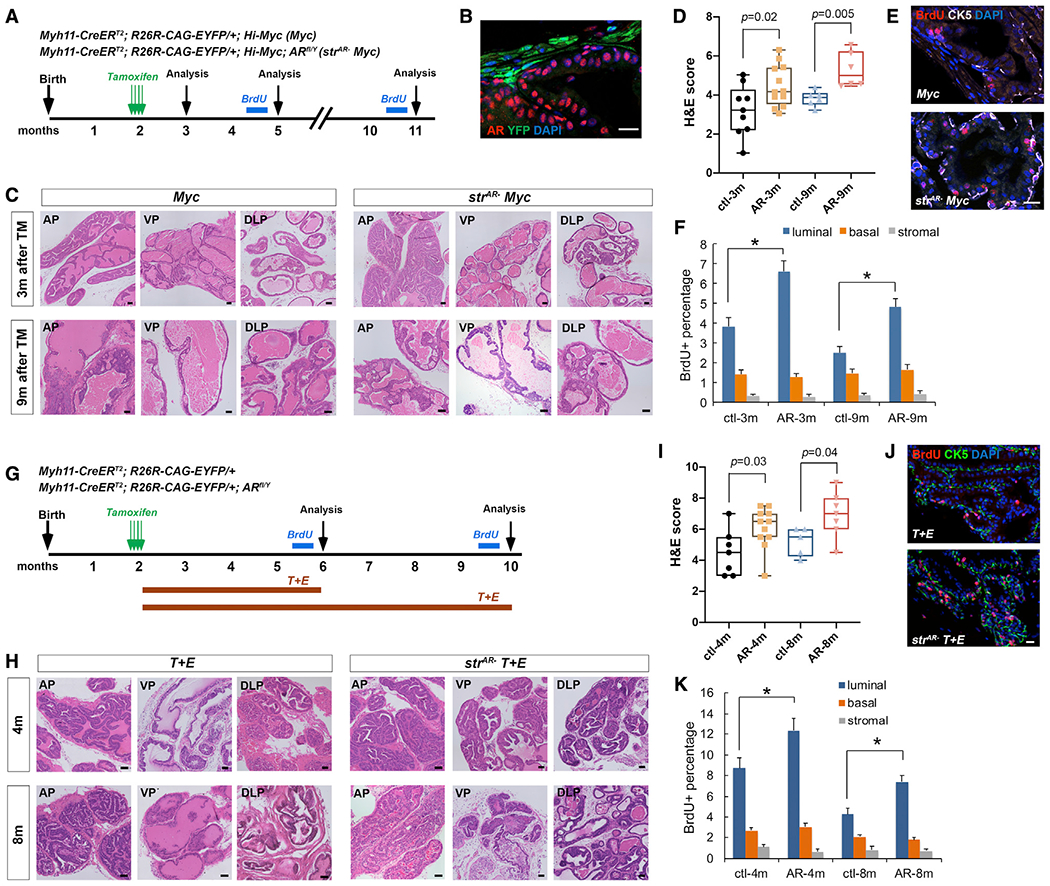
Figure 2. Stromal AR loss promotes tumor progression in the Hi-Myc and T + E models.

(A) Timeline of experiments for the Myc and strAR− Myc mice.
(B) IF showing efficient stromal AR deletion in strAR− Myc mice.
(C) Representative H&E images of different prostate lobes of Myc and strAR− Myc mice 3 and 9 months post induction.
(D) Quantitation of H&E scores.
(E) Representative IF staining of BrdU in Myc and strAR− Myc mice 9 months post induction.
(F) Quantitation of the proportions of BrdU+ cells in the basal, luminal, and stromal layers of Myc and strAR− Myc mice 3 and 9 months post induction.
(G) Timeline of experiments for the T + E and strAR− T + E mice.
(H) Representative H&E images of different prostate lobes of T + E and strAR− T + E mice 4 and 8 months post treatment.
(I) Quantitation of H&E scores.
(J) Representative IF staining of BrdU in T + E and strAR− T + E mice 8 months post treatment.
(K) Quantitation of the proportions of BrdU+ cells in the basal, luminal, and stromal layers of T + E and strAR−T+E mice 4 and 8 months post treatment. Each dot in (D) and (I) represents a mouse in the group. *p < 0.05 by Student’s t test. Scale bars in (B), (E), and (J), 20 μm, and in (C) and (H), 100 μm.
