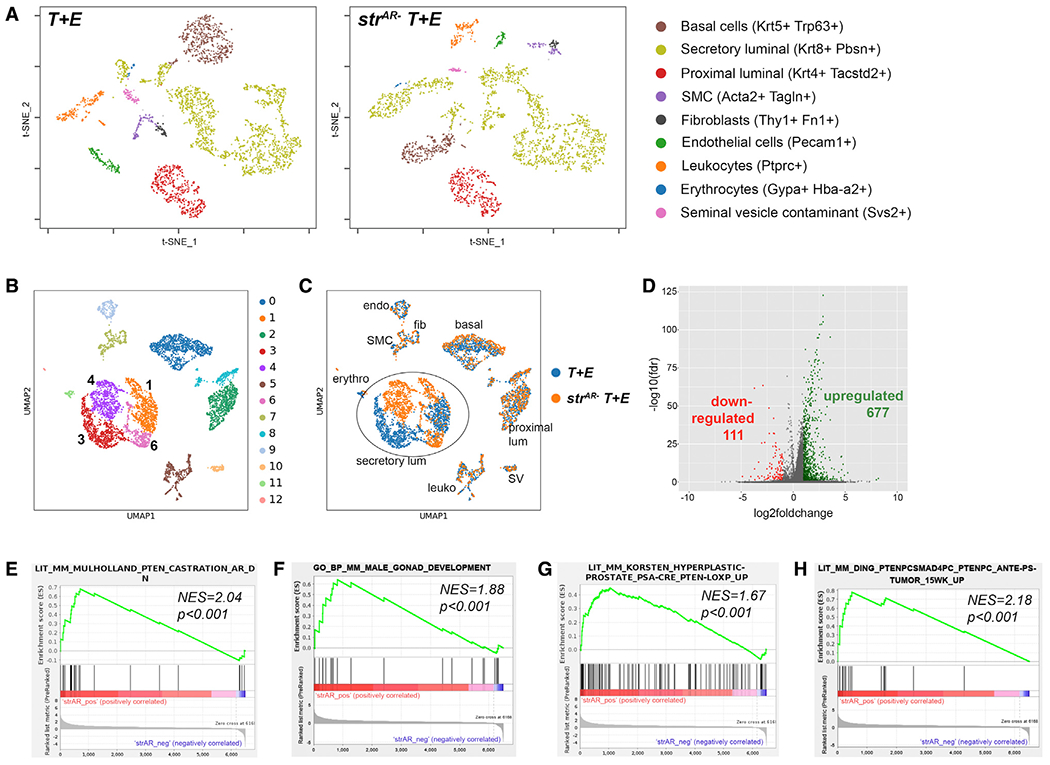
Figure 3. scRNA-seq analysis of T + E and strAR− T + E prostate.

(A) t-SNE plots showing various cell populations (identifiable by markers listed on the right) in the T + E and strAR− T + E prostate.
(B) UMAP showing color-coded cell clusters of integrated samples using scVI tools.
(C) UMAP showing alignment of cell types between the T + E and the strAR− T + E samples.
(D) Volcano plot showing up- and downregulated genes in strAR− T + E versus T + E.
(E–H) GSEA comparing differentially expressed genes in secretory luminal cells of strAR− T + E versus T + E against GO pathways and published gene signatures.
