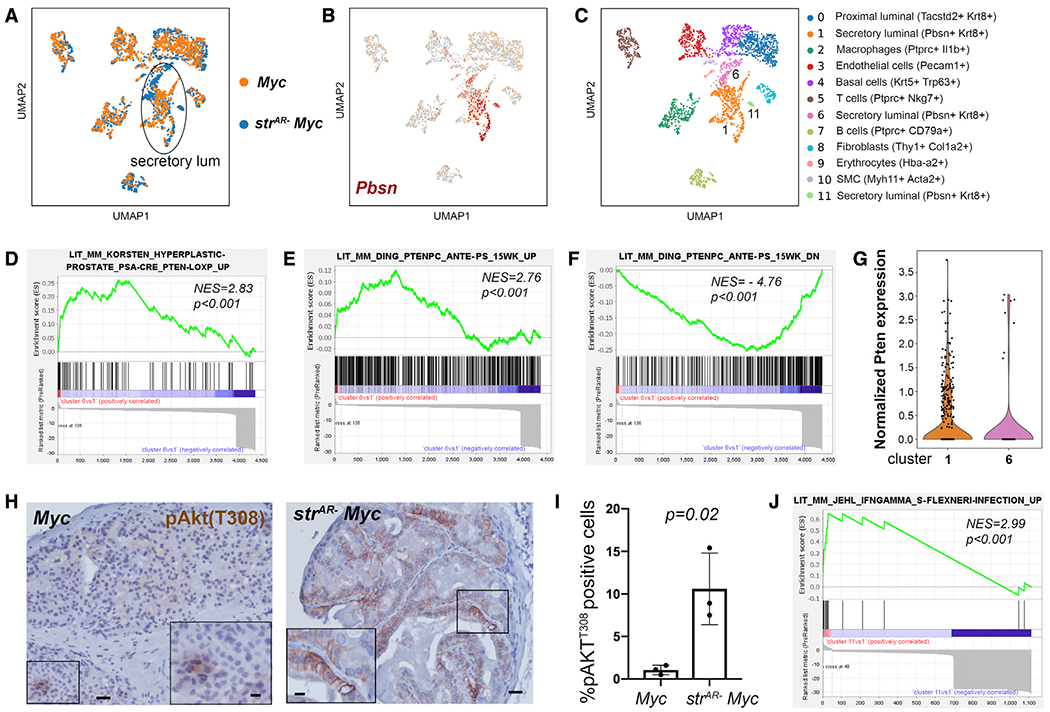
Figure 5. Single-cell analysis comparing Myc and strAR− Myc prostate.

(A) UMAP showing alignment of cell types between the Myc and the strAR− Myc prostate.
(B) Identification of secretory luminal clusters based on Pbsn expression.
(C) UMAP showing color-coded cell clusters of integrated samples using scVI tools and assignment of cell types based on marker expression.
(D–F) GSEA comparing differentially expressed genes in cluster 6 versus 1 against published Pten-null tumor gene signatures.
(G) Violin plot showing Pten expression in clusters 1 and 6.
(H) Representative IHC images showing pAkt-T308 staining in Myc (left) and strAR− Myc (right) tissues. Scale bars, 50 μm. Scale bars in insets, 10 μm.
(I) Quantitation of percentages of pAkt-T308-positive epithelial cells. n = 3 animals per group. The p value was calculated by Student’s t test.
(J) GSEA showing enrichment of upregulated genes in cluster 11 versus 1 in a published IFNγ-induced gene signature.
