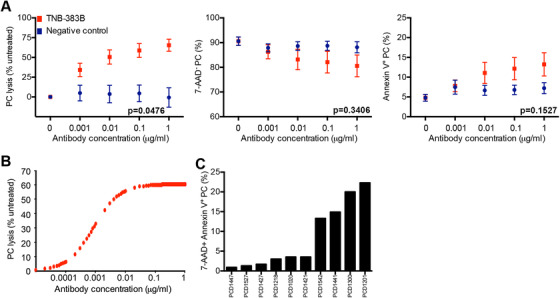
FIGURE 1.

TNB‐383B anti‐plasma cell activity ex vivo. A, Interaction of treatment analysis to determine the impact of treatment (TNB‐383B vs. negative control) and dose (0.001 μg to 1 μg) on PC lysis, viability and apoptosis. Tukey's sequential trend test was performed for each experimental treatment group, and each variable tested, utilizing ANOVA models and contrast statements to detect a linear trend in experiments involving increasing doses. B, Dose‐dependent PC lysis induced by TNB‐383B using Emax parametric model to estimate dose response curves, interpolating between tested doses. C, PC apoptotic rate (% 7‐AAD+ Annexin‐V+) distribution among the 10 BMMC preparations tested following 24 ± 2 h ex vivo treatment with 1 μg/mL TNB‐383B
