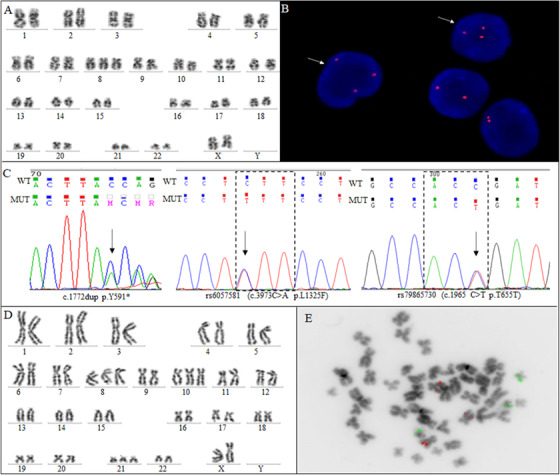
FIGURE 1.

Cytogenetic and molecular alterations in a well‐controlled HIV patient with MDS. A, G‐banded showing the karyotype 47,XX,+8. B, FISH analysis using LSI MYC SpectrumOrange, red signal, with interphase nuclei counterstain with DAPI, Vysis. The arrows show an extra copy of the c‐myc gene, showing the gain of chromosome 8. C, Electropherogram of ASXL1 sequencing showing a frameshift mutation in exon 12 (c.1772dup; p.Y591*A) and two single nucleotide polymorphisms identified in exon 12 of ASXL1 (c.3973C>A p.L1325F; c.1965 C>T p.T655T). Arrows indicate the point of the mutation and polymorphisms. D, G‐banded showing the karyotype 49,XX,+8,+10,+21. E, FISH analysis using the probe LSI RUNX1 break apart (RUNX1 21q2 spectrum green/RUNX1T1 8q21spectrum orange) showing a metaphase with three red signals demonstrating the trisomy 8 and three green signals showing the trisomy 21
