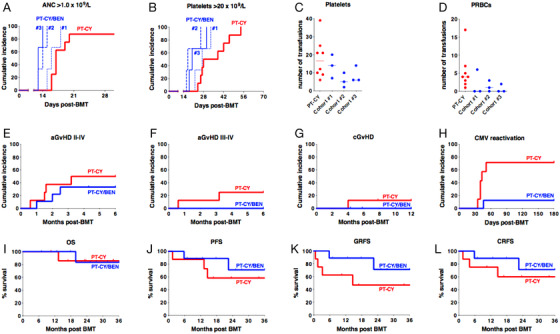
FIGURE 1.

A, Time to an absolute neutrophil count (ANC) of 1 × 10⁹/L. Median time PT‐CY, 17 days; Cohort #1, 16 days (P = .14); Cohort #2, 14 days (P = .0004); Cohort 3, 13 days, (P = .0005). B, Time to a platelet count of 20 × 109/L. Median time PT‐CY, 33 days; Cohort #1, 27 days (P = .18); Cohort #2, 17 days (P = .0007); Cohort #3, 20 days (P = 0.07). C, Number of units of platelets transfused. Median PT‐CY, 16.5 units; Cohort #1, 14 units, (P = n.s.); Cohort #2, 5 units (P = .05); Cohort #3, 6 units, (P = n.s.). D, Number of units of packed red blood cells (PRBCs) transfused. Median PT‐CY, 4 units; Cohort #1, 0 units (P = n.s.); Cohort #2, 1 unit (P = .07); Cohort #3, 0 units (P = .03). E, Cumulative incidence of grades II‐IV acute graft‐versus‐host disease (aGvHD); (P = n.s.). F, Cumulative incidence of grades III‐IV aGvHD; (P = n.s.). G, Cumulative incidence of chronic GvHD; (P = n.s.). H, Cumulative incidence of CMV viremia; (P = .016). I, Overall survival (OS); (P = n.s.) J, Progression‐free survival (PFS); (P = n.s.) K, Graft‐versus‐host‐free‐relapse‐free survival (GRFS); (P = n.s.). L, Chronic graft‐versus‐host‐free‐relapse‐free survival (CRFS); (P = n.s.).
