FIGURE 5.

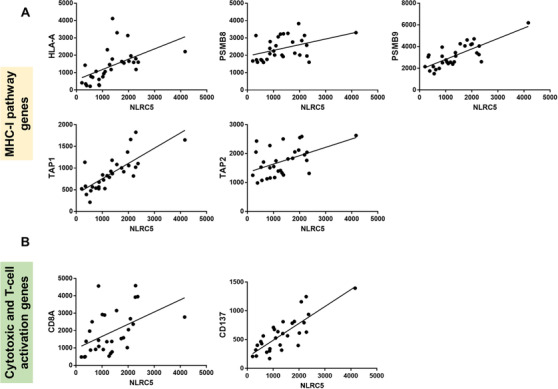
Gene expression correlations of NLRC5 (A) with MHC‐I pathway and (B) with cytotoxic T‐cell (CD8A) and T‐cell activation (CD137) genes. All correlations r > 0.7, P < .0001

Gene expression correlations of NLRC5 (A) with MHC‐I pathway and (B) with cytotoxic T‐cell (CD8A) and T‐cell activation (CD137) genes. All correlations r > 0.7, P < .0001