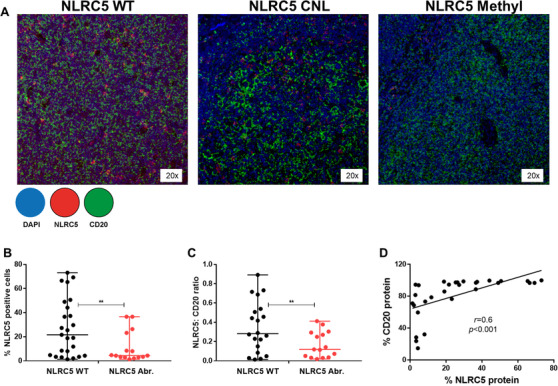
FIGURE 6.

NLRC5 protein expression in FL tumours stratified by NLRC5 status. A, Representative multispectral microscopic visualisation of NLRC5 (red) and CD20 (green) with 4′ 6‐diamidino‐2‐phenylindole (DAPI; dark blue) as the nuclear marker. B, Mean percentage of NLRC5‐positive cells. C, NLRC5:CD20 ratio and D, correlation of NLRC5 and CD20 protein expression in NLRC5 WT (four tissue sections) and in NLRC5 Abr. (three tissue sections) determined by acquisition of five random regions‐of‐interest for each sample at 20x resolution. WT, wild‐type; NLRC5 Abr., NLRC5 copy number lost/promotor methylated cases. **P < .01. Error bars, mean with SD.
