
FIGURE 4.
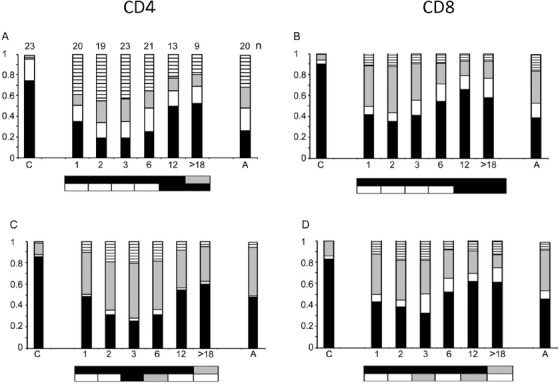
T Cell stages. RTE analysis of (A) CD3+ CD4+, (B) CD3+ CD4‐ cells: Relative proportions of CD45RA+ CD31+ (RTE, black); +/– (white), –/+ (grey), –/– (stripes). Maturation state analysis of (C) CD3+ CD4, (D) CD3+ CD8 cells: CD45RA+ CCR7+ (naïve, black), +/– (effector memory RA+, white), –/+ (central memory, grey), –/– (effector memory, stripes). ‘C’ cord blood and ‘A’ adult blood, horizontal axis numbers indicate months after transplant. The boxes below the plots represent t‐test comparisons against UCB and AB (as in Figure 2) for black bar sub‐populations: RTE (CD45RA+ CD31+) and naïve cells (CD45RA+ CCR7+). The number (n) of samples analysed for each set of markers is indicated above the bars in Figure 4A