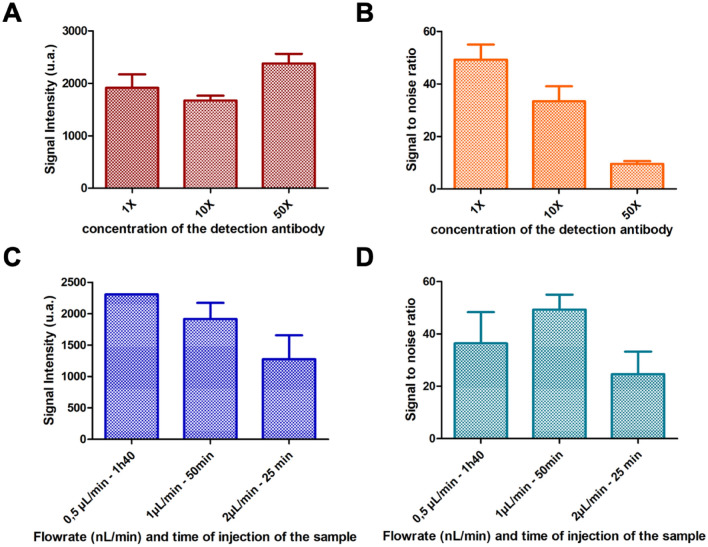
Figure 2.
On-chip assay optimization. Signal intensity for a 5 ng/mL sample (A) and signal to noise ratio (B) of the performed manually in-tube labeling ELISA mode as a function of the concentration of the detection antibody: 0.5 µg/mL, 5 µg/mL and 25 µg/mL. Signal intensity for a 5 ng/mL sample (C) and signal to noise ratio (D) of the immunoassay as function of the flowrate and the time of injection of the sample for three conditions: 0.5 μL/min, 1 μL/min and 2 μL/min. The analysis was performed as described in the Material and Methods.

