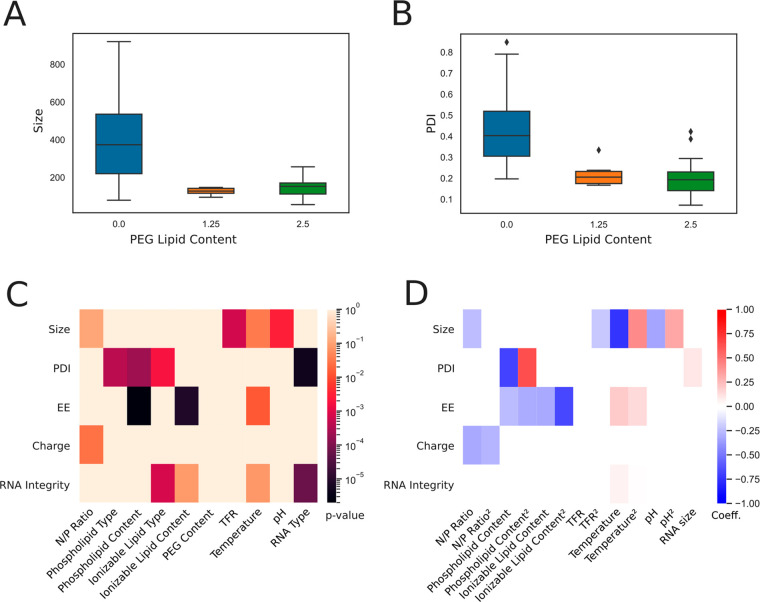
Figure 2.
Statistical analysis from definite screening design experiments (Iteration A). (A, B) Box plot displaying LNP size and PDI as a function of PEG lipid content. (C) Heat map of correlations (p-value) from ANOVA carried out on the restricted data set. Explanatory variables with p-value < 0.1 are excluded from ANOVA model. (D) Heat map of regression coefficients for main and quadratic effects detected by ANOVA.

