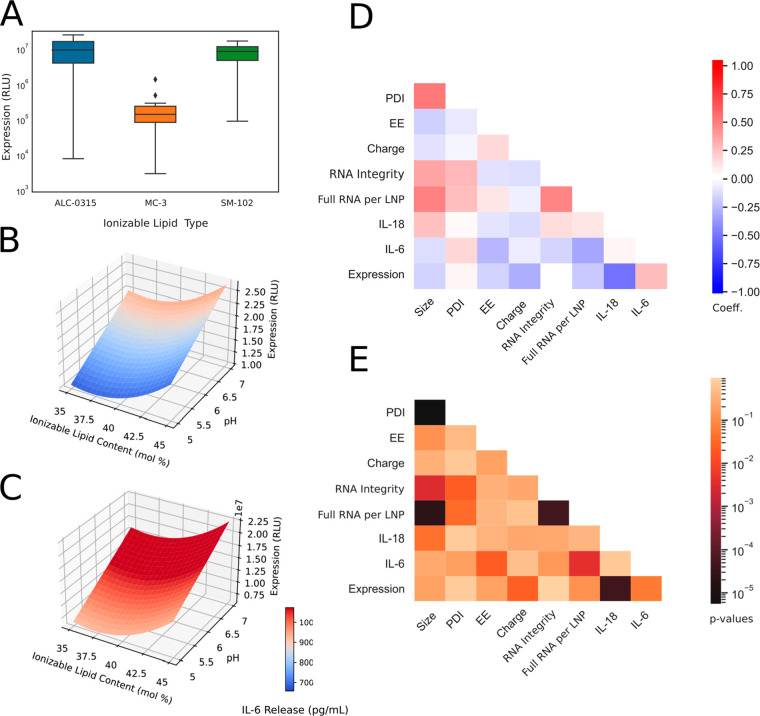
Figure 4.
LNP protein expression profile and statistical analysis from BBD experiments (Iteration B). (A) Box plot displaying protein expression (RLU) as a function of ionizable lipid type. (B) Response surface plot for protein expression for LNP containing ALC-0315 ionizable lipid. (C) Response surface plot for protein expression for LNP containing SM-102. Heat map plot displaying Spearman correlation’s coefficient (D) and p-values (E) between CQAs. LNPs containing MC3 ionizable lipid are excluded from the protein expression analysis in B–E due to low expression levels.

