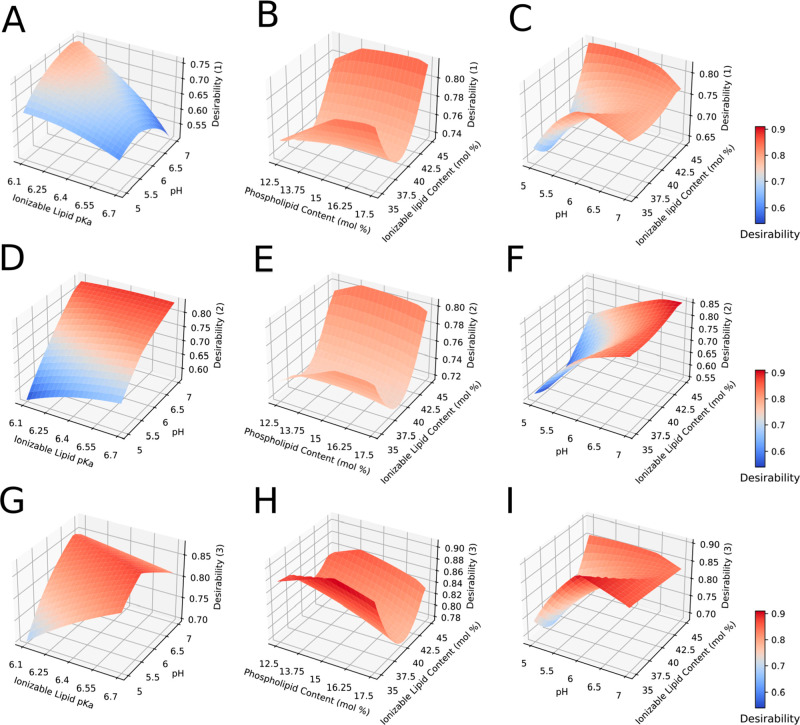
Figure 5.
Multiple response surface plot from BBD (Iteration B) based on desirability function optimization. IL-6 cytokine release is minimized in panels A–C (Desirability (1)) and maximized in panels D–F (Desirability (2)). In panels G–I, only physical CQAs are optimized (Desirability (3)). Nondisplayed explanatory variables are fixed at center point (see Table 2).

