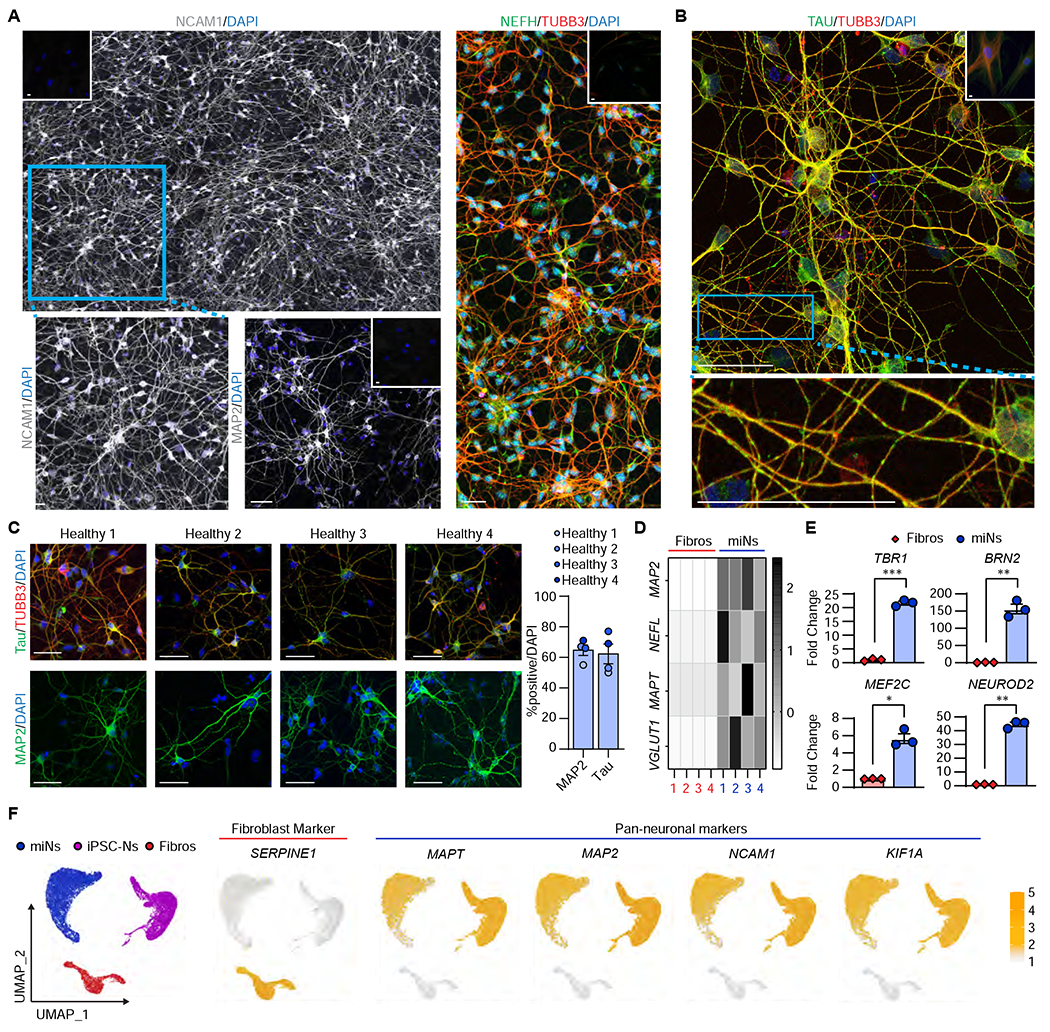
Figure 1 |. Directly-reprogrammed neurons display neuronal morphology and transcriptome.

(A) Representative images of miNs from healthy adult individuals (Healthy 3+4) at post-induction day (PID) 30 immunostained with NCAM (composite of 3x2 40x images stitched together), MAP2, NEFH, and TUBB3. Insets at the corners are immunostaining images performed in starting fibroblasts. Blue rectangular outline depicts the region shown in magnified images. Scale bars = 50 μm. (B) Representative image of Healthy 4 immunostained for total tau and TUBB3. Inset is starting fibroblasts. Blue rectangular outline depicts the magnified region showing tau islands. Scale bars = 50 μm. (C) Left, representative images of healthy miNs stained for tau and TUBB3. Right, quantification of % positive over DAPI in reprogrammed cells from four independent fibroblast samples (MAP2 Number of cells counted: miN 1=140, miN 2=82, miN 3=112, miN 4=169; MAPT Ns: miN 1=113, miN 2=118, miN 3=78, miN 4=87). Scale bars = 50 μm. (D) Heatmap plots Z-scores comparing qPCR of neuronal genes between miNs and starting fibroblasts from four independent samples. (E) Fold change of cortical genes between starting fibroblasts and day 30 miNs. n=3 replicates from miNs grown in three independent wells. Mean±SEM.; two-tailed Student’s t-test; *p ≤ 0.05, **p < 0.01, ***p ≤ 0.001. (F) Left, UMAP projection of cells colored by starting cell type (Fibroblast: n=2533 cells; iPSC-N: n=7212 cells; miN: n=9305 cells). Right, UMAP projection of cells colored by non-neuronal (SERPINE1) and pan-neuronal markers (MAPT, MAP2, NCAM1, KIF1A). See also Figure S1.
