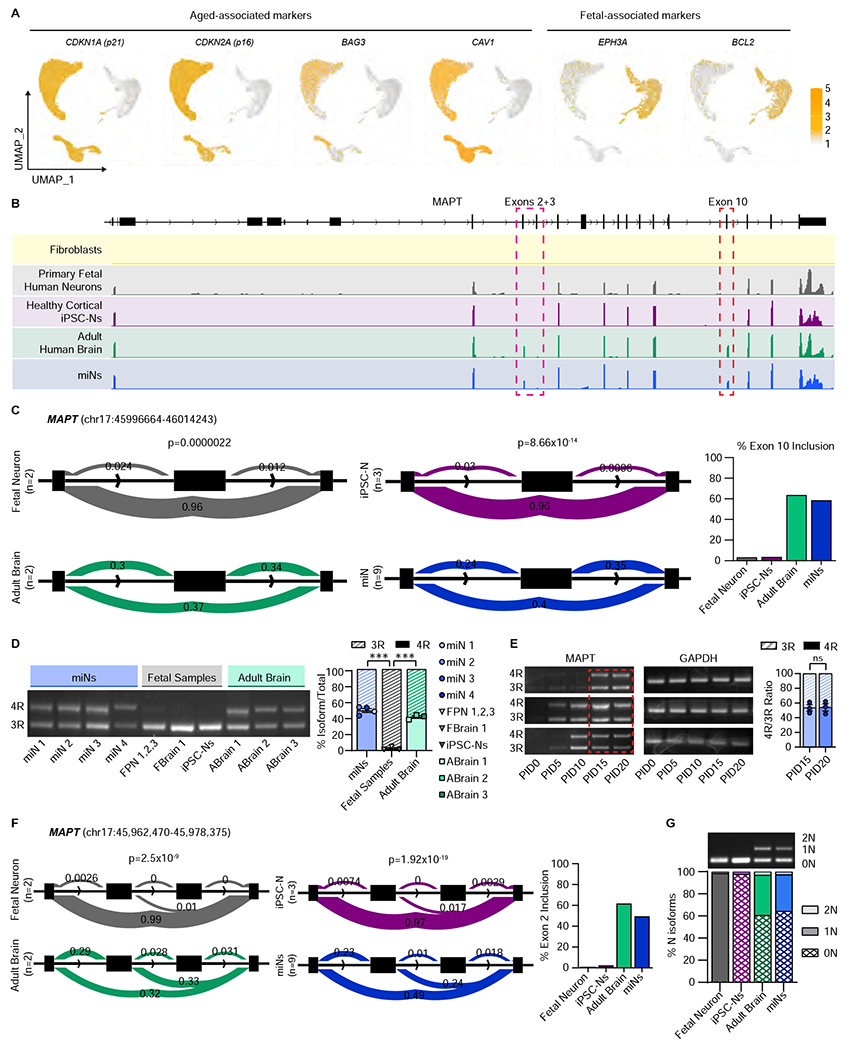
Figure 2 |. MiNs express exon 10 inclusion at equivalent ratio to the adult human brain.

(A) UMAP projection of cells colored by age-associated markers (CDKN1A, CDKN2A, BAG3, and CAV1) and fetal-associated markers (EPHA3 and BCL2). Cell numbers as indicated in Figure 1F. (B) Representative RNA-seq tracks at the MAPT locus of fibroblasts, primary human neurons, cortical iPSC-Ns, adult human brain, and miNs at PID21. (C) Leafcutter analysis of MAPT exon 10 inclusion between fetal neurons and adult brain, and healthy iPSC-Ns and healthy miNs. Percent exon 10 inclusion is quantified on the right. For primary fetal neurons and adult brain, n= sequencing replicates performed from purchased purified RNA (see STAR Methods). For iPSC-Ns, n=replicates grown in three independent wells. For miNs, n=three independent well replicates from three independent individuals. (D) Left, semi-quantitative PCR of 3R and 4R tau isoforms. Right: Quantification of 3R and 4R percent ratio of samples grouped by miNs, fetal samples, and adult brain from independent individuals as indicated in the graph legend. Mean±SEM; One-way ANOVA with multiple comparisons with post hoc Tukey’s test; ***p ≤ 0.001. (E) Semi-quantitative PCR of 3R and 4R tau expression. Red rectangular outline depicts the time point when 4R tau starts being expressed consistently in multiple samples (n=three independent individuals). Right, Two-tailed Student’s T-test of PID15 vs PID20. Mean±SEM; ns p = 0.92. See also Figure S2 and Tables S1 and S2.
