
Figure 5 |. IVS10+16 patient-derived miNs demonstrate increased 4R protein corresponding to increased 4R mRNA.
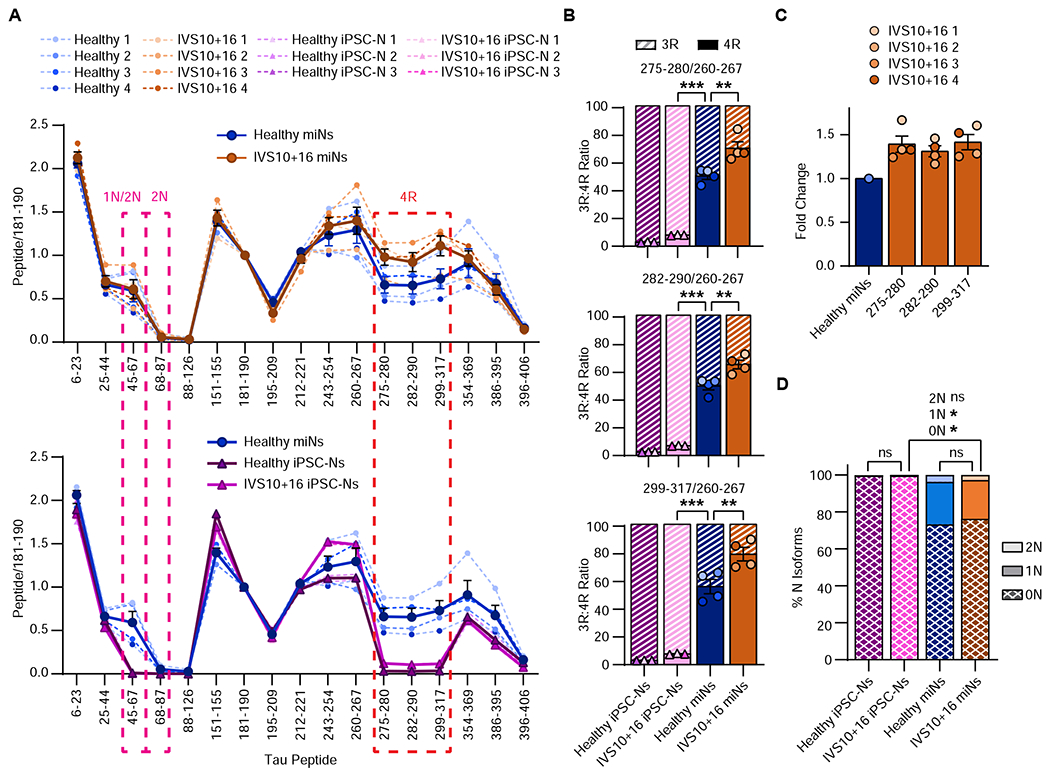
(A) Quantitation of relative tau peptides from multiple independent samples as indicated in the plot legend. Mean(thick line)±SEM. (B) Quantification of 3R:4R isoform ratio of all samples used in Figure 5A. Histogram colors are matched to sample colors shown in the plot legend of Figure 5A. Mean±SEM. One-Way ANOVA with multiple comparisons and post hoc Tukey’s test; healthy miNs vs IVS10+16 miNs: 275-280 **p = 0.004, 282-290 **p = 0.004, 299-317 **p = 0.008. Between any miN and iPSC-N: all peptides ***p ≤ 0.001. C) Fold change of 4R isoform expression for all three 4R-specific peptides over healthy miNs. (D) Percentage of N isoforms using all samples as indicated in the plot legend in Figure 5A. Mean±SEM; One-Way ANOVA with multiple comparisons and post hoc Tukey’s test. For all N isoforms: between healthy iPSC-Ns and IVS10+16 iPSC-Ns: ns p > 0.999; between healthy miNs vs IVS10+16 miNs: 0N: ns p = 0.97; 1N: ns p = 0.983; 2N: ns p = 0.887; between IVS10+15 miNs vs IVS10+16 iPSC-Ns: 0N: *p = 0.038; 1N: *p = 0.027; 2N: ns p = 0.285.