Figure 1.

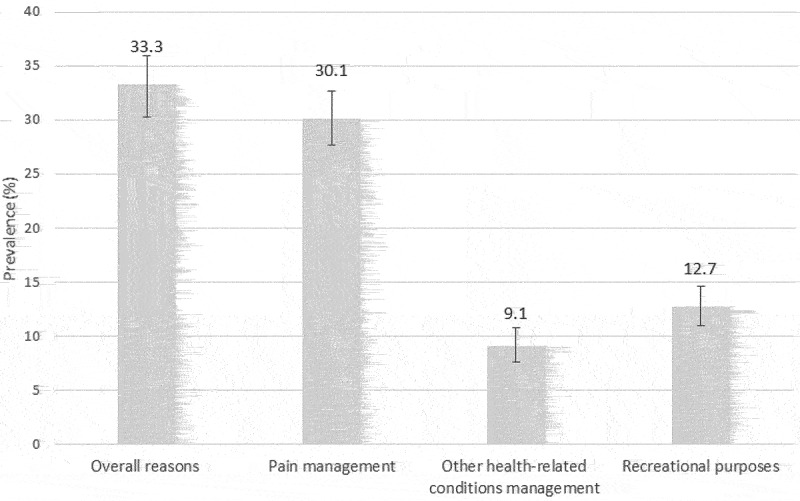
Prevalence of cannabis use according to reasons for use. Error bars represent 95% CIs. Non-mutually exclusive groups, because participants could check more than one reason.

Prevalence of cannabis use according to reasons for use. Error bars represent 95% CIs. Non-mutually exclusive groups, because participants could check more than one reason.