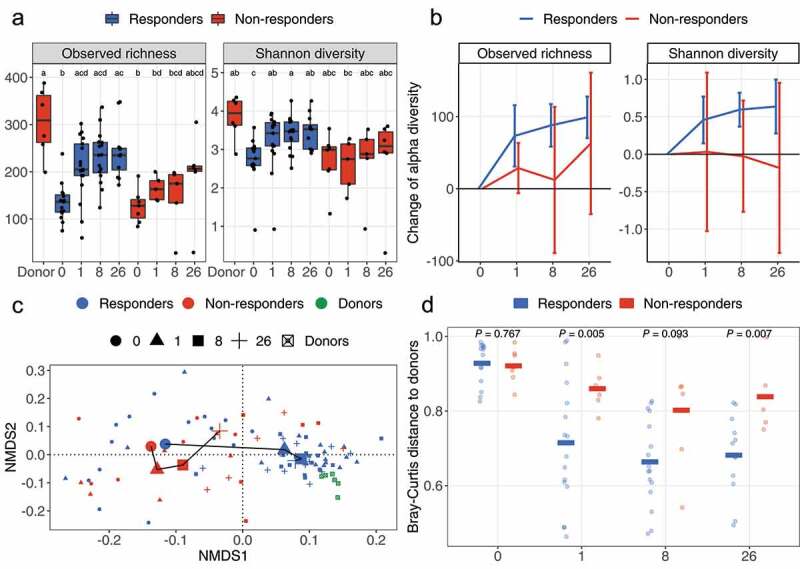
Figure 1.

Change of alpha and beta diversity between outcomes. (a) The observed richness and Shannon diversity for responders, non-responders, and donor samples. Alphabet letters are the Tukey’s post -hoc test; sharing same letters indicate no significant difference at a level of 0.05. (b) The change of observed richness and Shannon diversity within patients and averaged by outcomes. The error bars refer to the 95% confidence interval of the mean estimated with paired Welch’s t-test. Error bars not overlapping the zero value indicate significant changes compared to pre-FMT (W0). (c) The beta diversity of samples from response and non-response patients assessed with Bray-Curtis distance and visualized with nonmetric multidimensional scaling (NMDS) ordination. Shapes refer to time points or donor. Colors refer to outcomes or donor. Samples are shown with small shapes referring to different time points. The big shapes represent the centroid of sample groups in each condition and connected with lines in the order of time point. (d) Bray-Curtis distance between patient samples and corresponding donor samples. Each dot refers to one distance between a given patient and the processed feces coming from the corresponding donor. The crossbars represent mean value distances. P values are obtained with the Welch’s t-test. For (a) and (c), the taxa abundances in fecal samples coming from the same donor (in total six donors provided 24 samples) were averaged so that each donor is represented by a single community.
