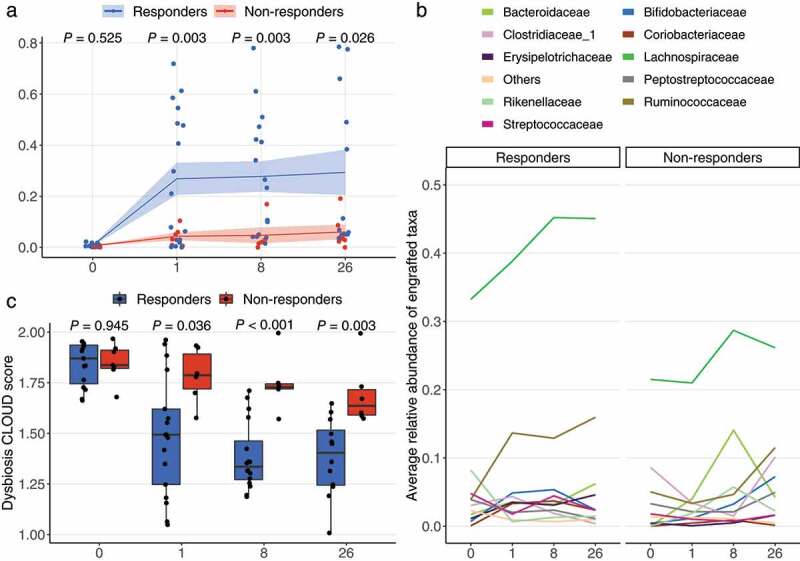
Figure 3.

Engraftment of donor microbes and improvement of dysbiosis score. (a) Engraftment of donor microbes was estimated with the SourceTracker program using each patient as the “sink” and the corresponding donor as the “source”. Lines crossing time points represent the mean similarity in the microbial communities between donors and patients. The shaded area indicates standard error of the mean. P values were obtained by Welch’s t-test. (b) The top 10 most engrafted families. ASVs engrafted in patients were identified with SourceTracker and their relative abundances were summed at the family level. The top 10 most abundant families are shown and the remaining are merged as “Others”. (c) Dysbiotic status of patients as estimated with the CLOUD test. Patients (test sample) were tested against the donors (reference) using CLOUD, and the derived statistic from the test was used as the dysbiosis score, where smaller scores correspond to healthier bacterial communities. The differences in dysbiosis scores between outcomes were compared with Wilcoxon rank-sum test.
