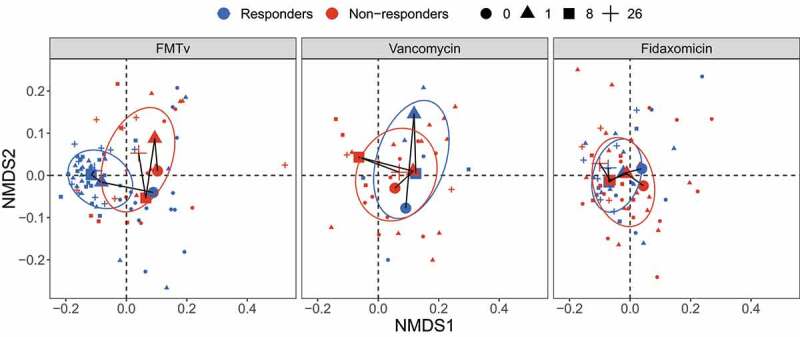
Figure 4.

Beta diversity of fecal microbiota for FMTv, vancomycin, and fidaxomicin treatments. Beta diversity is assessed based on the Bray-Curtis distance and visualized by NMDS ordination. Colors of dots and ellipses (50% confidence regions for clusters) refer to different outcomes. Samples are shown with small shapes referring to different time points. Big shapes represent the centroids of sample groups in each condition and are connected with lines according to sample time.
