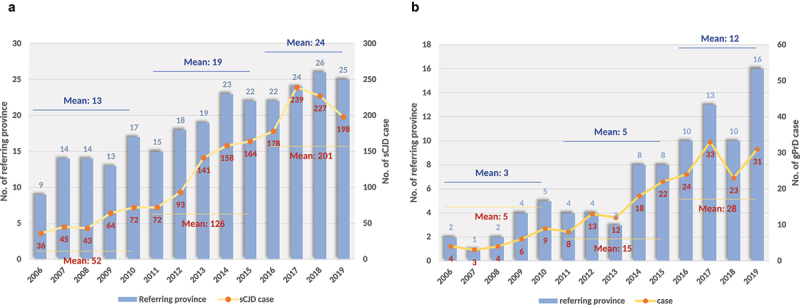
Figure 1.

The numbers of the diagnosed PrD cases and the referring provinces from 2006 to 2019. A. sCJD cases. B. gPrD cases. Yellow curves with Orange points represent the numbers of PrD cases (showing in right Y axis). Light blue columns represent the numbers of referring provinces (showing in left Y axis). The surveillance years are indicated in X axis.
