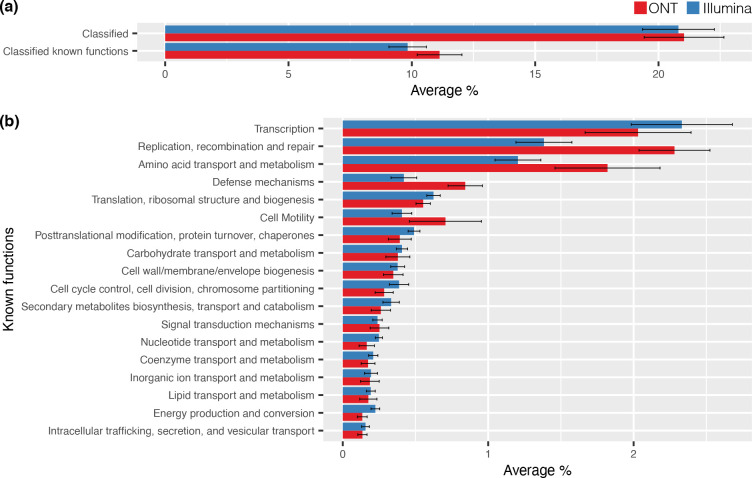
Fig. 4.
COG functional analysis of cassette-encoded proteins recovered with the HS287/HS286 primer set. (a) Average (±1 S.E) percentage of proteins per sample (n=12) that can be classified into functional categories. On average ~20 % of cassette-encoded proteins can be classified by a COG category, half of which fall into categories of known function. (b) The average (±1 S.E) proportion of proteins within a sample assigned to each of the known functional categories. The complete list of protein sequences assigned a COG functional category is presented in Table S1.

