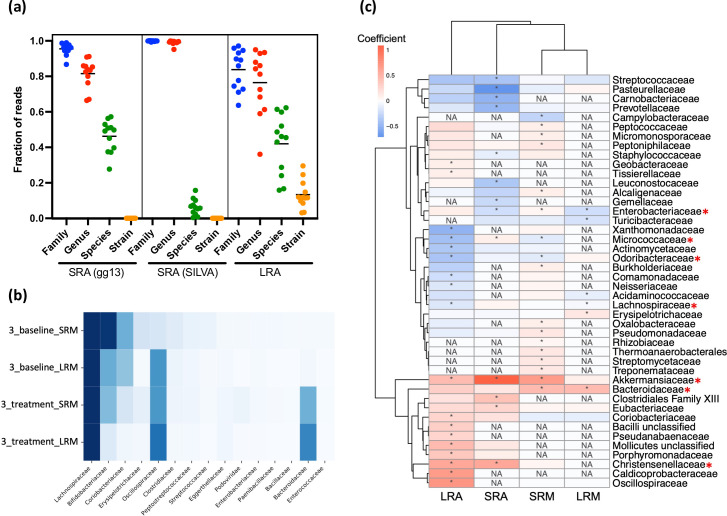
Fig. 3.
(a) The fraction of reads for each sample assigned to the specified taxonomy level for SRA and LRA. Horizontal lines show the mean fraction of reads assigned to each taxonomy level for each method. (b) Comparison of family relative abundances in participant 3’s baseline and treatment samples across metagenomics methods. The scale shows percent relative abundance. (c) The heatmap shows the families that were significantly differentially abundant between baseline and treatment samples in at least one method (asterisks in heat map denote P<0.2 for SRA, LRA, and SRM and P<0.25 for LRM). The red asterisks indicate families that were differentially abundant in more than one method.

