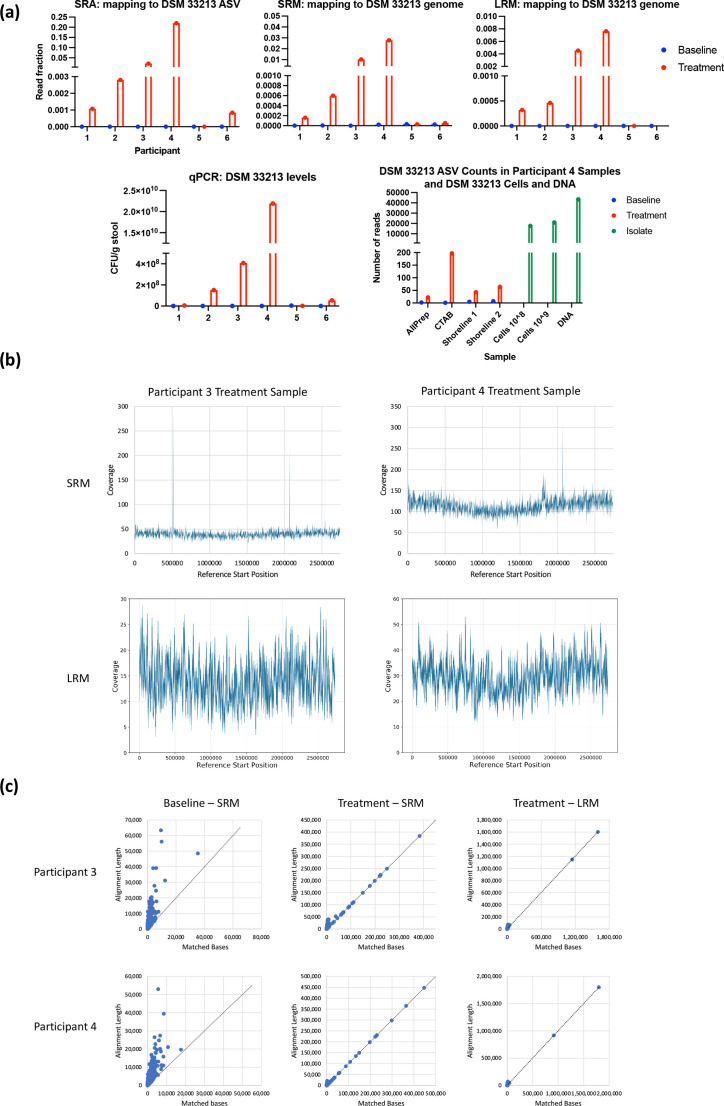
Fig. 4.
Detecting an active ingredient strain in treated samples. (a) The fraction of SRA reads in each sample at baseline or during treatment assigned to the DSM 33213 408 bp ASV (top row, left graph), or the fraction of SRM and LRM reads mapping to DSM 33213’s genome (top row, centre two graphs), compared to orthogonally verified levels of DSM 33213 in samples based on strain-specific qPCR (top right). The bottom graph shows levels of DSM 33213’s LRA ASV in participant 4’s samples at baseline and treatment. All four replicates of the sample, with DNA extracted using different methods, show DSM 33213’s ASV present in treatment but not baseline replicates. DSM 33213 cells and DNA were included in the library preparation and sequencing as positive controls and are shown in green. DSM 33213’s ASV was not detected in other participants’ treatment samples. (b) Genomic coverage plots of SRM (top) and LRM (bottom) reads from participant 3 and 4’s treatment samples. (c) Contigs assembled from SRM and LRM baseline and treatment samples from participants 3 and 4 mapped to DSM 33213’s genome. Plots show the number of matched bases versus the total length of the alignment between each contig and the DSM 33213 genome. Dotted lines have a slope of 1 to show the reference for a perfect alignment.

