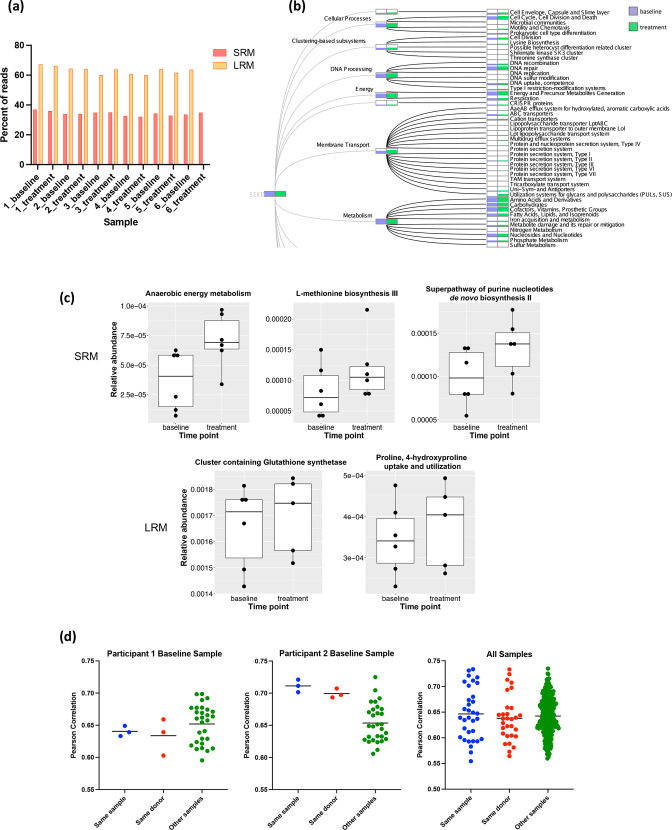
Fig. 5.
Comparison of functional annotation across methods. (a) The percent of reads for each sample with assigned, known functional annotation for SRM and LRM. Short reads were assigned functional annotations by HUMAnN2 using the UniProt90 database, and long reads were assigned functional annotations by MEGAN-LR using the SEED database. LRM library preparation failed for the treatment sample from participant 6 and was excluded from this analysis. (b) Comparing the representation of SEED-based categories from LRM analysis in participant 3’s baseline and treatment samples. (c) Significantly differentially abundant pathways comparing baseline and treatment samples based on SRM (top row) and LRM (bottom row). For SRM, pathways were annotated with MetaCyc, and for LRM, pathways were annotated with SEED. (d) Plots show the Pearson correlation between the specified sample’s LRM-based EC profile and the PICRUSt2-based EC profile based on LRA for the same sample, for the other sample from the same participant, or for all other samples. The first two plots show examples of Pearson correlations for specific samples, and the third plot shows the Pearson correlations for all samples. Horizontal lines represent the mean Pearson correlation.

