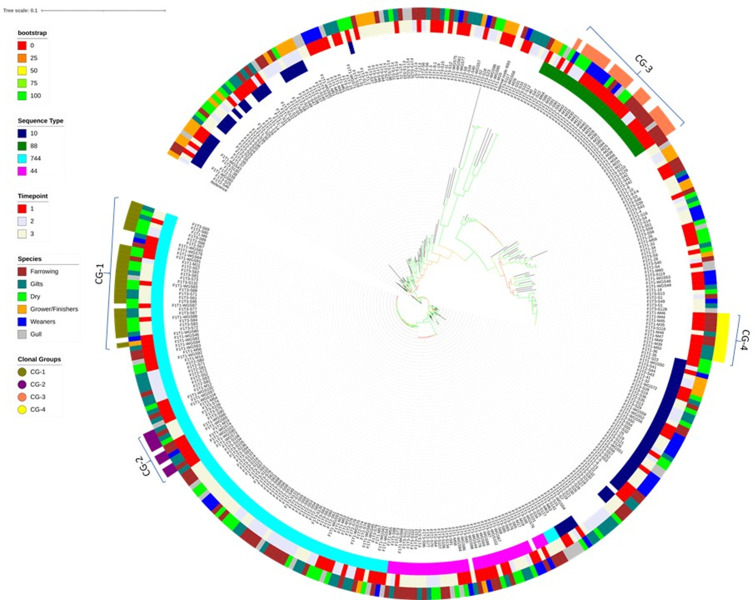
Fig. 1.
A whole genome SNP-based maximum-likelihood tree demonstrating phylogenetic relatedness of 385 E. coli isolates sequenced during the study. Genetic relatedness of isolates is demonstrated by branch length and confidence in clades by bootstrap confidence values, illustrated by coloured branches. Dominant STs (ring 1), time-points (ring 2) and source animal (ring 3) are illustrated by peripherally coloured rings. Clonal groups (CG) are demonstrated by brackets, while clones are highlighted in the outer ring (ring 4).

