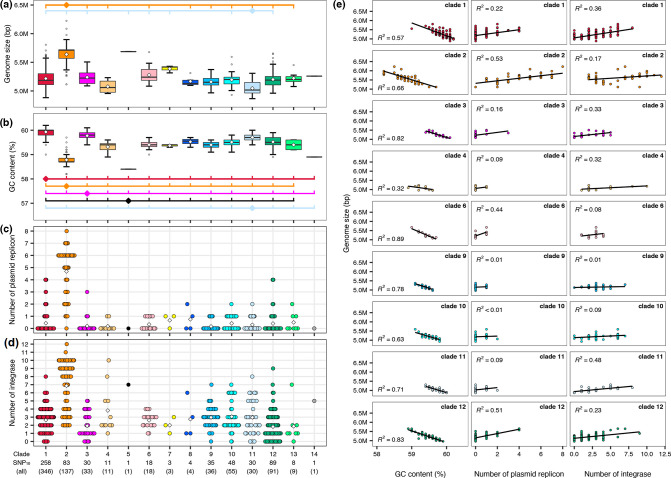
Fig. 6.
Interclade differences in genome size and GC content. Genome size ranges (a) and GC content ranges (b) of SNP10 clusters belonging to each clade. For multimember SNP10 clusters, one strain was randomly selected from each cluster. Open diamonds in the boxplot indicate the mean values of each clade. Clades that show significant differences (P<0.01) compared to the clades marked by diamonds are indicated by short vertical lines. Lines are coloured according to the clade indicated by diamonds. Only the combinations that show significant interclade differences are shown. The numbers of total strains and SNP10 clusters in each clade are shown at the bottom of (d). (c, d) The numbers of plasmid replicons and integrase genes found in the SNP10 clusters belonging to each clade. Diamonds indicate the averages in each clade. (e) Correlations between genome size and GC content (left) and between genome size and the numbers of plasmid replicons (middle) or integrase genes (right) in nine clades that contained >10 members. Linear regression lines and R-squared results are shown. In all panels, colours for each clade are the same as those in Figs. 3–5.

