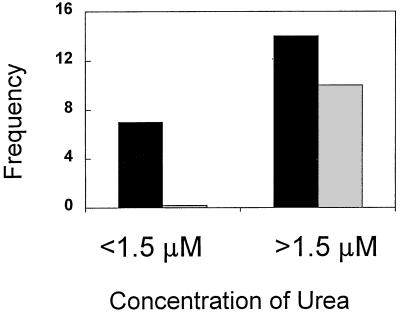
FIG. 1.
Frequency diagram of number of sampling periods in which urea concentrations were <1.5 or >1.5 μM N (solid bars) and number of sampling periods in which dinoflagellate blooms developed (shaded bars) in commercial hybrid striped bass (M. saxitilis and M. chrysops) aquaculture ponds in Maryland in 1997.

