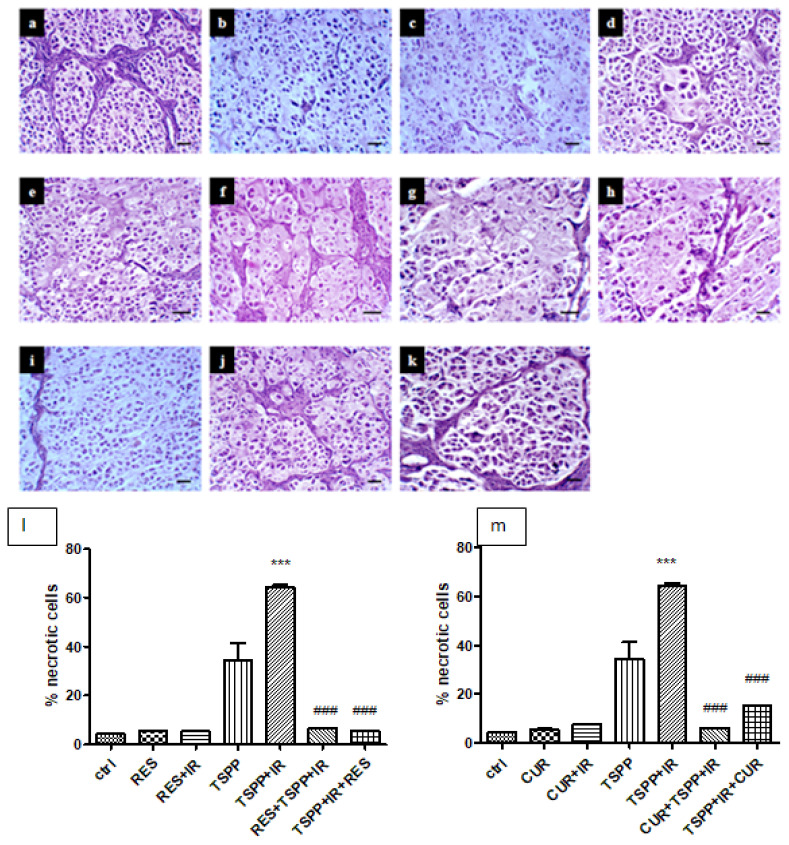
Figure 8.
Histopathological examination of tumor sections for necrosis assessment. a-control, b-CUR c-RES, d-CUR+IR, e-RES+IR, f-TSPP, g-TSPP+IR, h-CUR+TSPP+IR, i-RES+TSPP+IR, j-TSPP+IR+CUR, k-TSPP+IR+RES, ×200, scale bar = 20 μm. Data are depicted as mean ± SD. Statistical analysis was made with one-way ANOVA, using Tukey’s multiple comparisons posttest ***p<0.001 as compared to control group and ###p<0.001 as compared to PDT group).

