Table 1.
| Cmpd | Structure | EC50 (μM)a (Emax)b |
Cmpd | Structure | EC50 (μM)a (Emax)b |
|---|---|---|---|---|---|
| 1a |
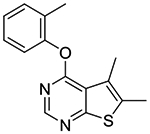
|
0.48
± 0.04 (118%) |
1k |
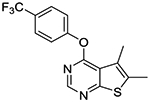
|
>100 |
| 1b |
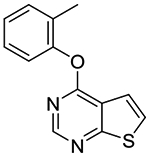
|
14.5
± 1.1 (88%) |
1l |
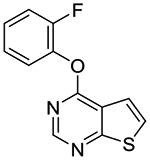
|
4.2 ± 1.1 (95%) |
| 1c |
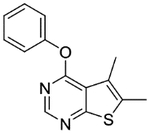
|
1.6
± 0.4 (89%) |
1m |
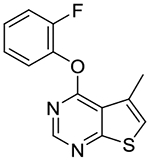
|
1.7 ± 0.2 (94%) |
| 1d |
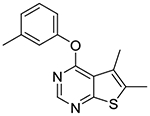
|
25 (40%) |
1n |
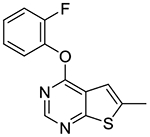
|
1.5 ± 0.2 (90%) |
| 1e |
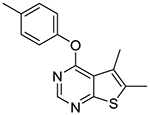
|
2.7
± 1.5 (88%) |
1o |
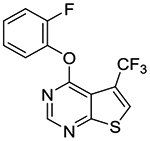
|
2.1 ± 0.4 (94%) |
| 1f |
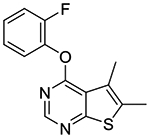
|
0.22
± 0.02 (112%) |
1p |
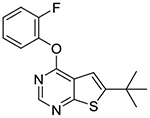
|
0.32 ± 0.06 (105%) |
| 1g |
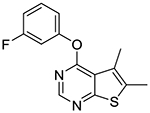
|
30 (55%) |
1q |
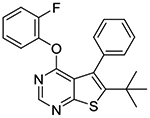
|
0.34 ± 0.07 (95%) |
| 1h |
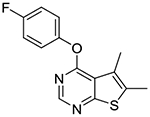
|
1.1
± 0.2 (83%) |
1r |
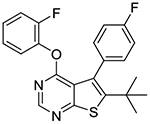
|
0.30 ± 0.13 (145%) |
| 1i |
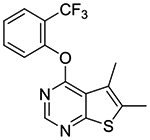
|
0.52
± 0.03 (95%) |
1s |
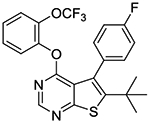
|
0.23 ± 0.05 (143%) |
| 1j |
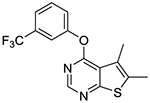
|
>100 | 1t |
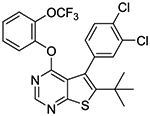
|
0.10 ± 0.01 (114%) |
Values are mean ± standard error of the mean (SEM) of at least three independent experiments performed in quadruplicate.
Emax values were defined as response elicited by maximum concentration of test compounds in the presence of EC20 concentration of BAM8–22 normalized to that elicited by 250 nM (>EC100) of BAM8–22 alone.
