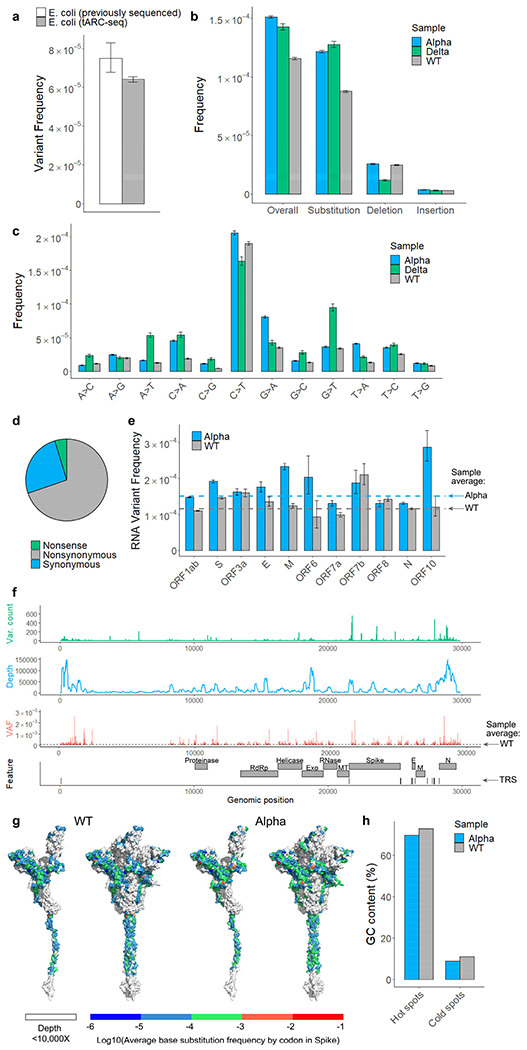
Figure 2 |. Spectrum and frequency of RNA variants in SARS-CoV-2.

a, tARC-seq reproduces known variant frequencies in E. coli. b, RNA variants were measured in ancestral SARS-CoV-2 (WT), the B.1.1.7 lineage (Alpha), and the B.1.617.2 lineage (Delta) using tARC-seq. Variants occurred at a frequency of 1.16 x 10⁻⁴ in WT virus, with higher rates observed in both Alpha and Delta. c, RNA variants were dominated by C>T and G>A transitions. d, Most variants are nonsynonymous. e, Genes encoding structural proteins like Spike show higher variant frequencies (Fisher exact test). f, Mapping variant allele fractions (VAF) by position across the SARS-CoV-2 genome reveals an uneven landscape. g, Base substitution frequencies by codon mapped against Spike protein illustrate the distribution of hot and cold spots for RNA variants. h, RNA variant hot spots show strong GC bias in vivo. Error bars represent Wilson score 95% confidence intervals. For analysis, a maximum 5% clonality cutoff was applied to the data and positions were filtered for ≥50X depth. A more stringent depth filter (≥10,000X) was applied to the position-wise analyses (f, g) to minimize skewing due to inadequate sampling.
