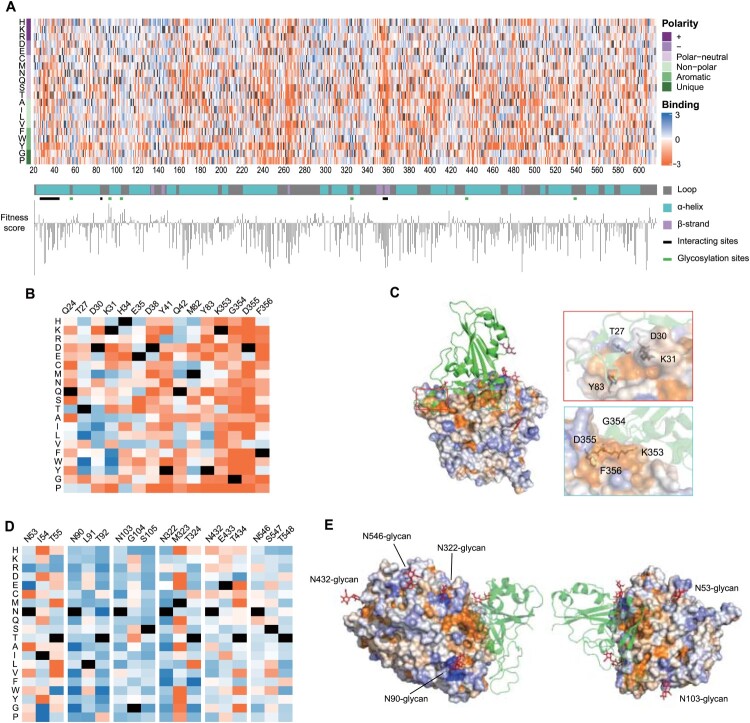
Figure 2.
Full-length ACE2-PD enrichment heatmap. (a) ACE2-PD saturated mutagenesis heatmap and classification. Fitness scores based on the average Log2 enrichment ratios from two replications of the RBD sorts were plotted from depletion or deleterious (orange) to enriched (blue). Positions on ACE2 protein were shown on the horizontal–vertical axis, and amino acid substitutions are indicated on the vertical axis. Magnified views of ACE2 positions that directly interact with RBD (b) and glycosylation sites (d). Colouring schemes were the same as in (a). (c) Fitness scores were mapped to the structure (PDB: 6M0J) of RBD (green cartoon)-bound protease domain (surface). Residues conserved for RBD binding were shown in orange; mutationally tolerant residues were in pale colours; residues that were hot spots for enriched mutations were in blue. (e) Views looking down onto the ACE2 glycosylation sites (PDB: 6M17). The colouring scheme was the same as in (a).

