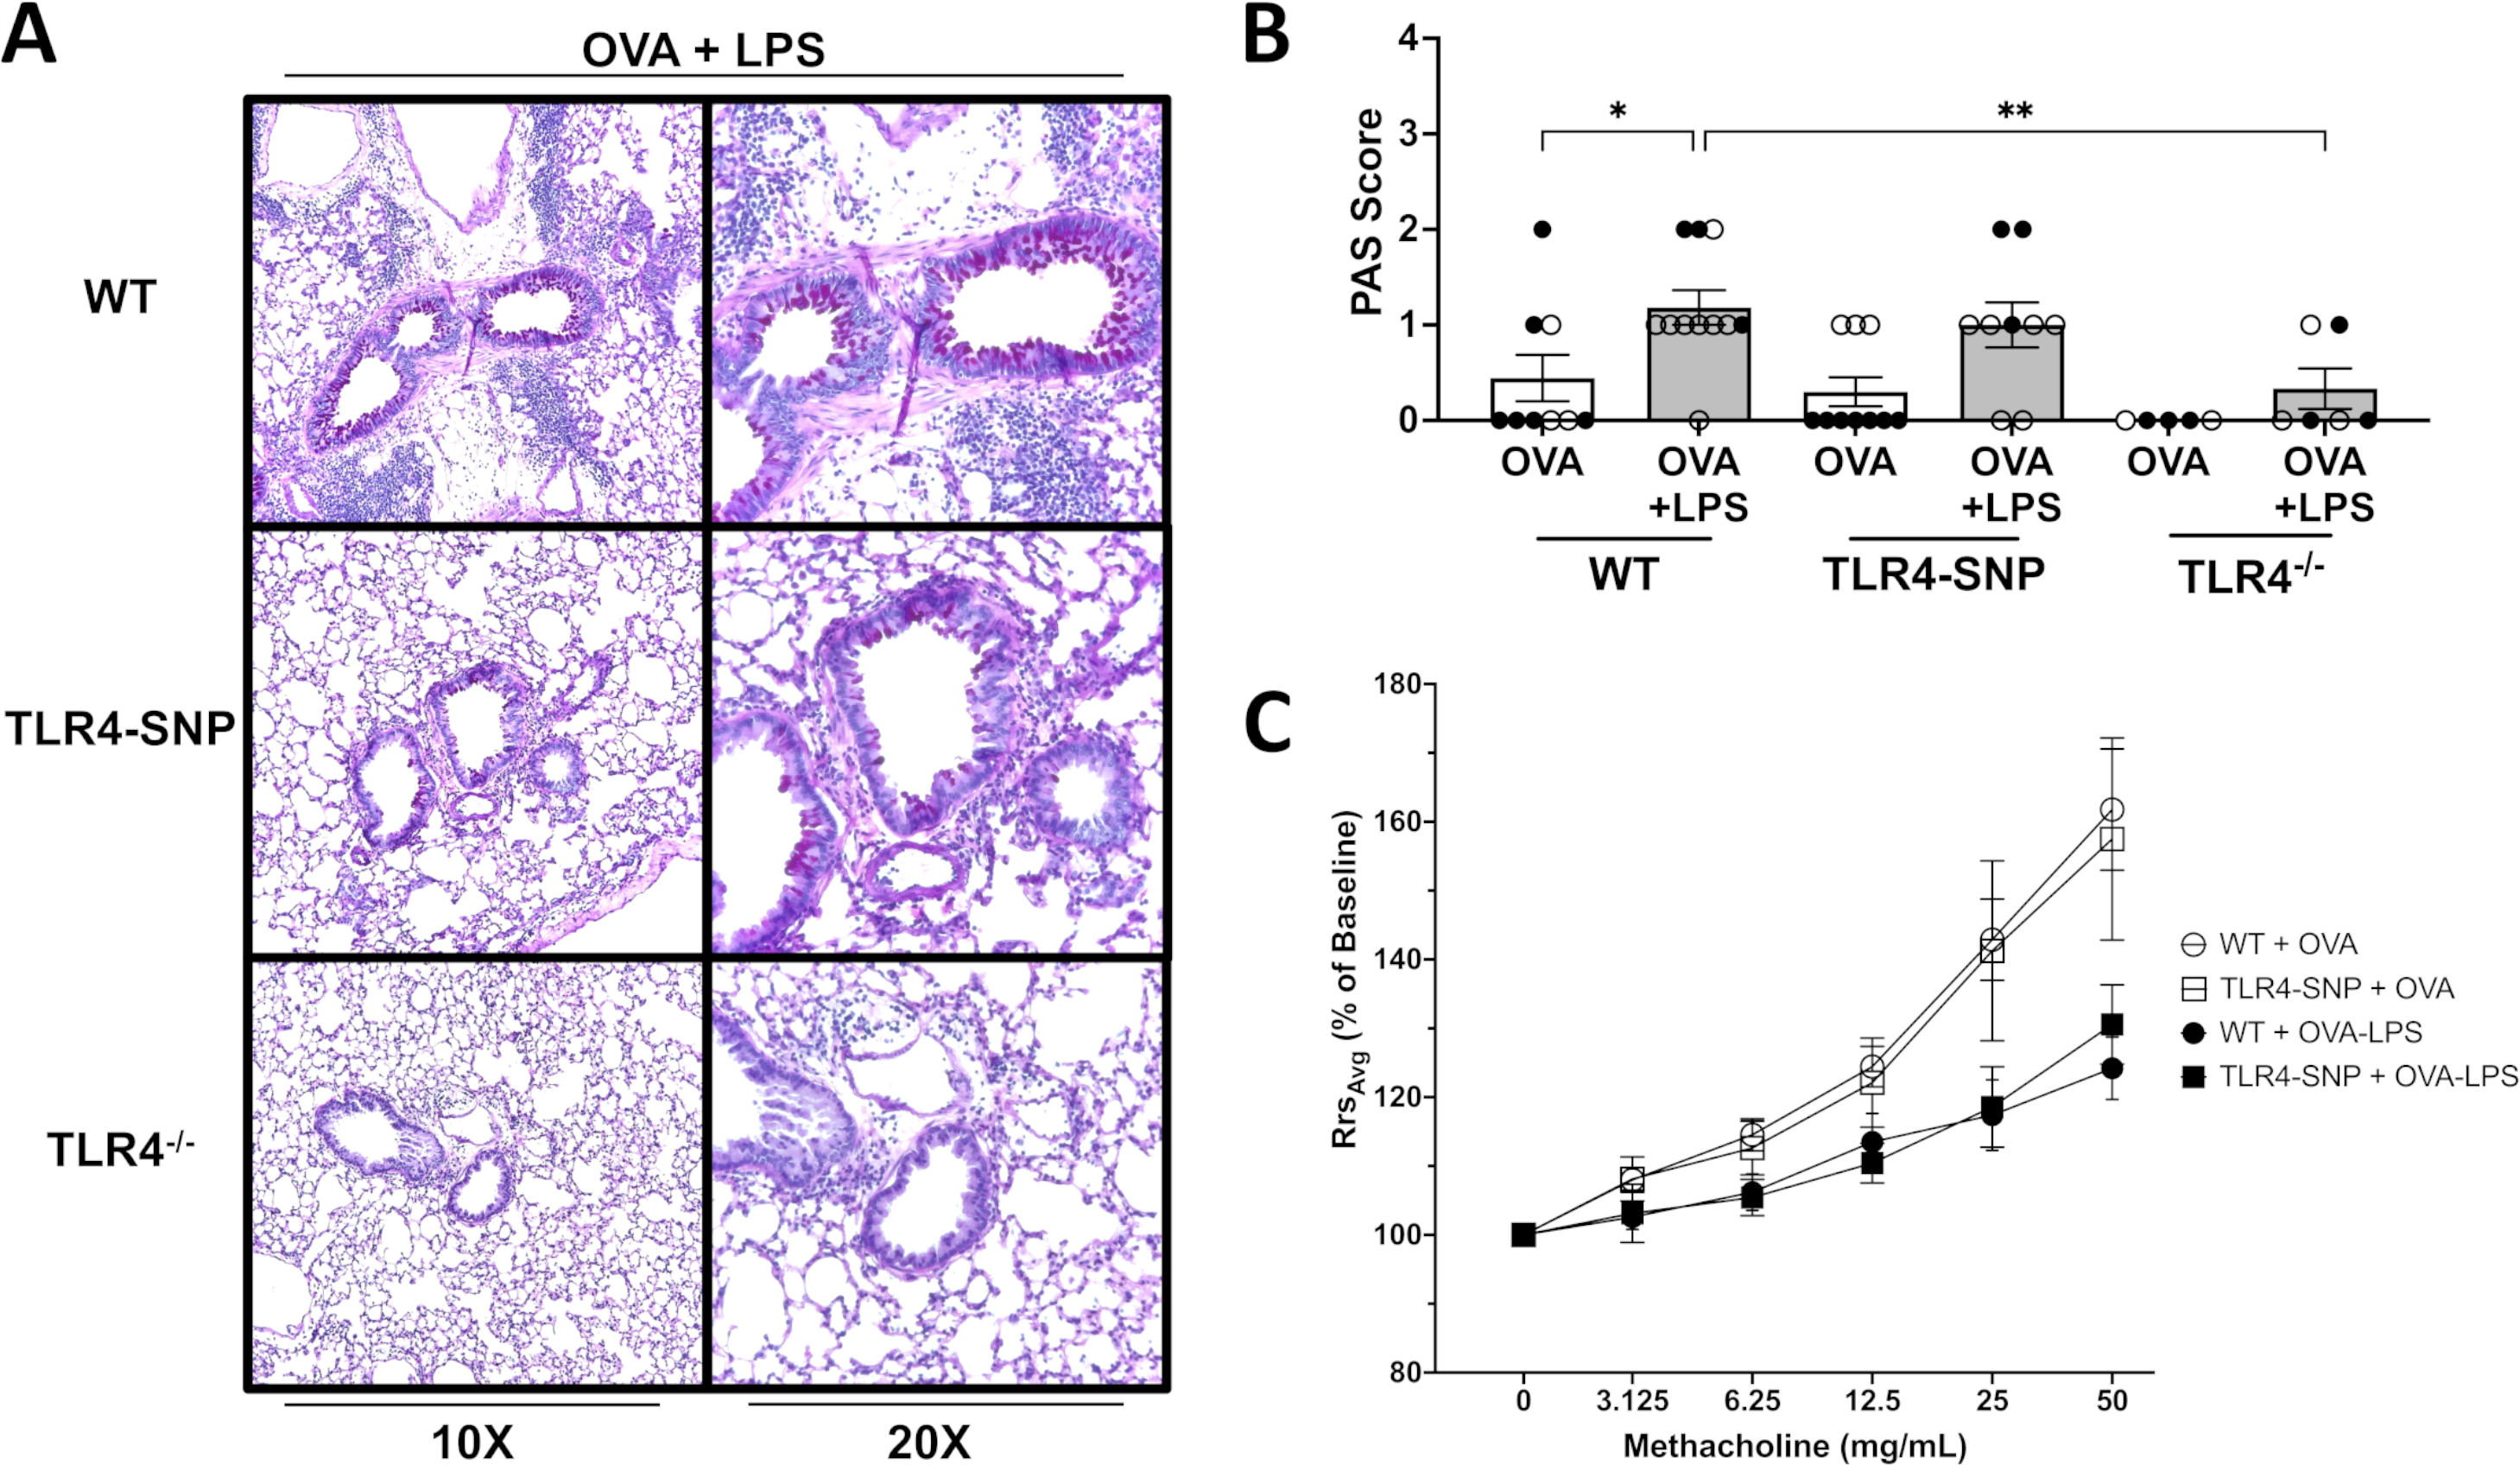
Figure 3: Mice that lack TLR4 produce less mucus after treatment with OVA and LPS.

Lung sections from WT, TLR4-SNP, and TLR4−/− mice were fixed, blocked, and then stained with a Periodic Acid Schiff Stain to determine mucous production at 10X and 20X lens magnification (A). Lung sections were then evaluated by a pathologist blinded to the experimental conditions and scored on a scale of 0–4 (B). Scoring is aggregated from 3 independent trials (n=5 mice/treatment group/trial) with each point representing an individual mouse. Airway hyperreactivity was measured using a SciReq Flexivent Ventilator (C). Mice were sedated prior to tracheostomy and then paralyzed. Airway resistance was measured after nebulization of increasing concentrations of methacholine by Flexivent measurements. Airway hyperreactivity was determined by calculating the fold change of resistance (Rrs) for each methacholine dose over baseline (% of baseline). Data is aggregated from 2 independent trials (n=4–5/treatment group/trial for OVA-treated groups, n=5/treatment group/trial for OVA-LPS-treated groups) with each point representing the mean value of 2 independent trials. Open circles designate females and closed circles designate males. Scoring data was analyzed by 2-way ANOVA with Tukey’s Multiple Comparisons Test: *, P<0.05; **, P<0.005; ***, P<0.0005; ****, P<0.0001. Airway hyperreactivity data analyzed by Kruskal-Wallis test with Dunn’s multiple comparison’s test with the following p-values (not shown). 50 mg: WT + OVA vs WT + OVA-LPS, p=0.0018 (**); 25 mg: WT + OVA vs WT + OVA-LPS, p=0.0313 (*). Error bars represent mean ± SEM.
